Trade Log – Week Ending Feb 29 2020

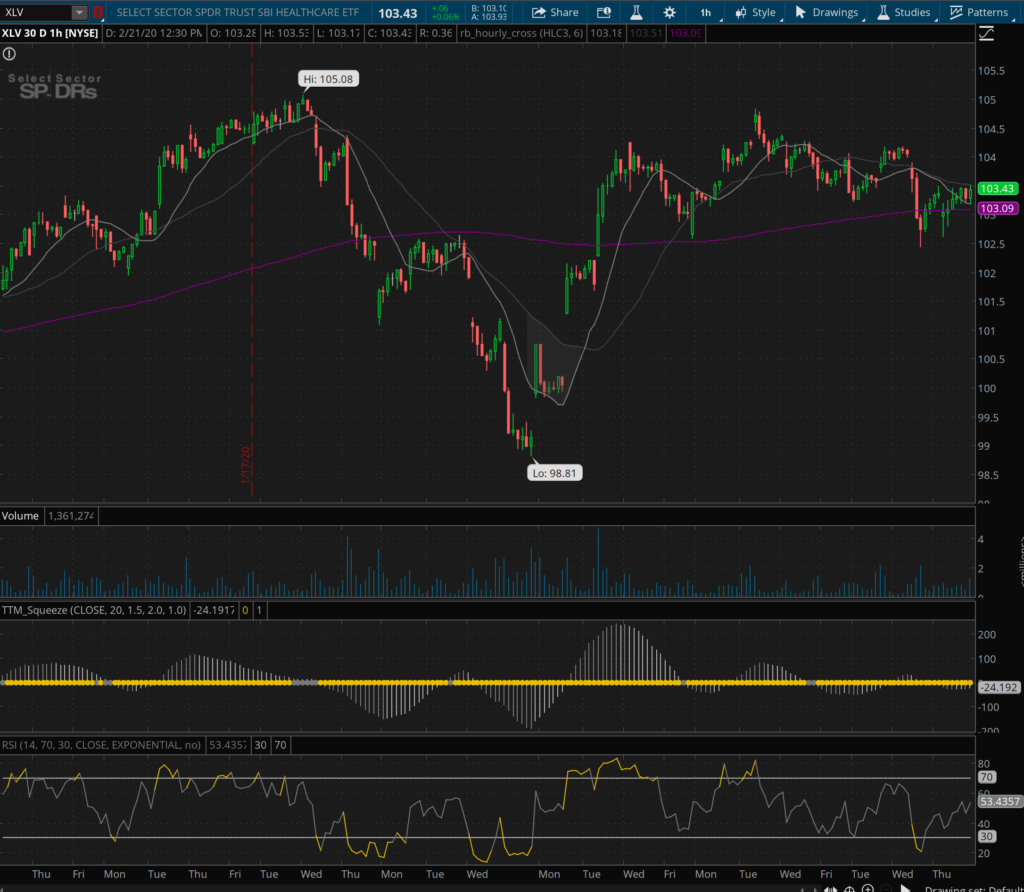
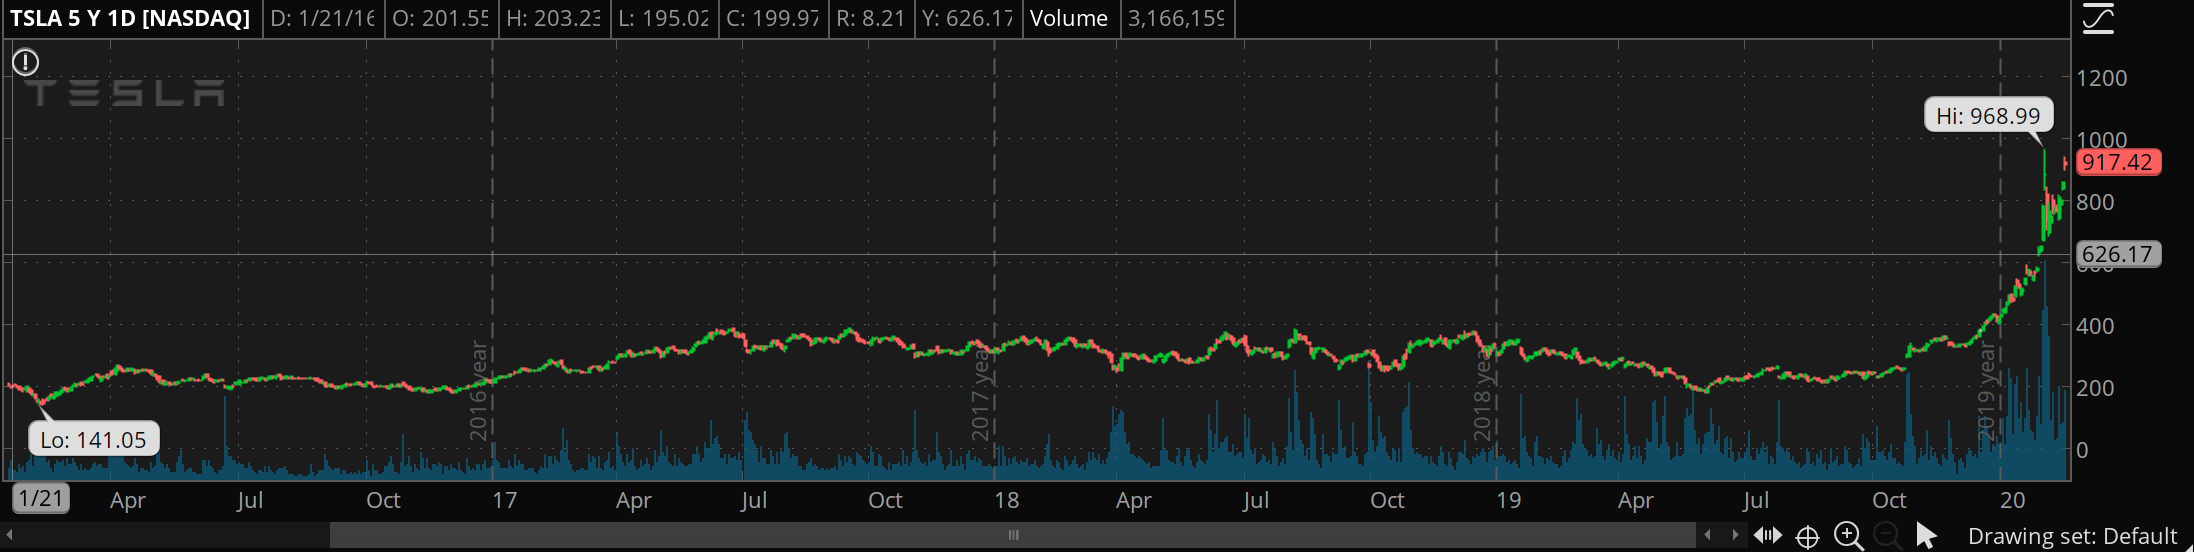
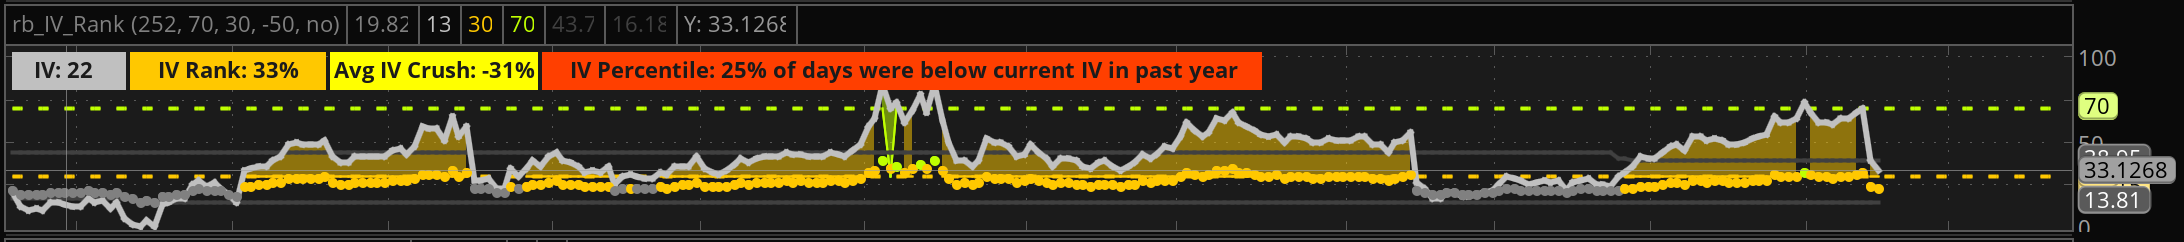
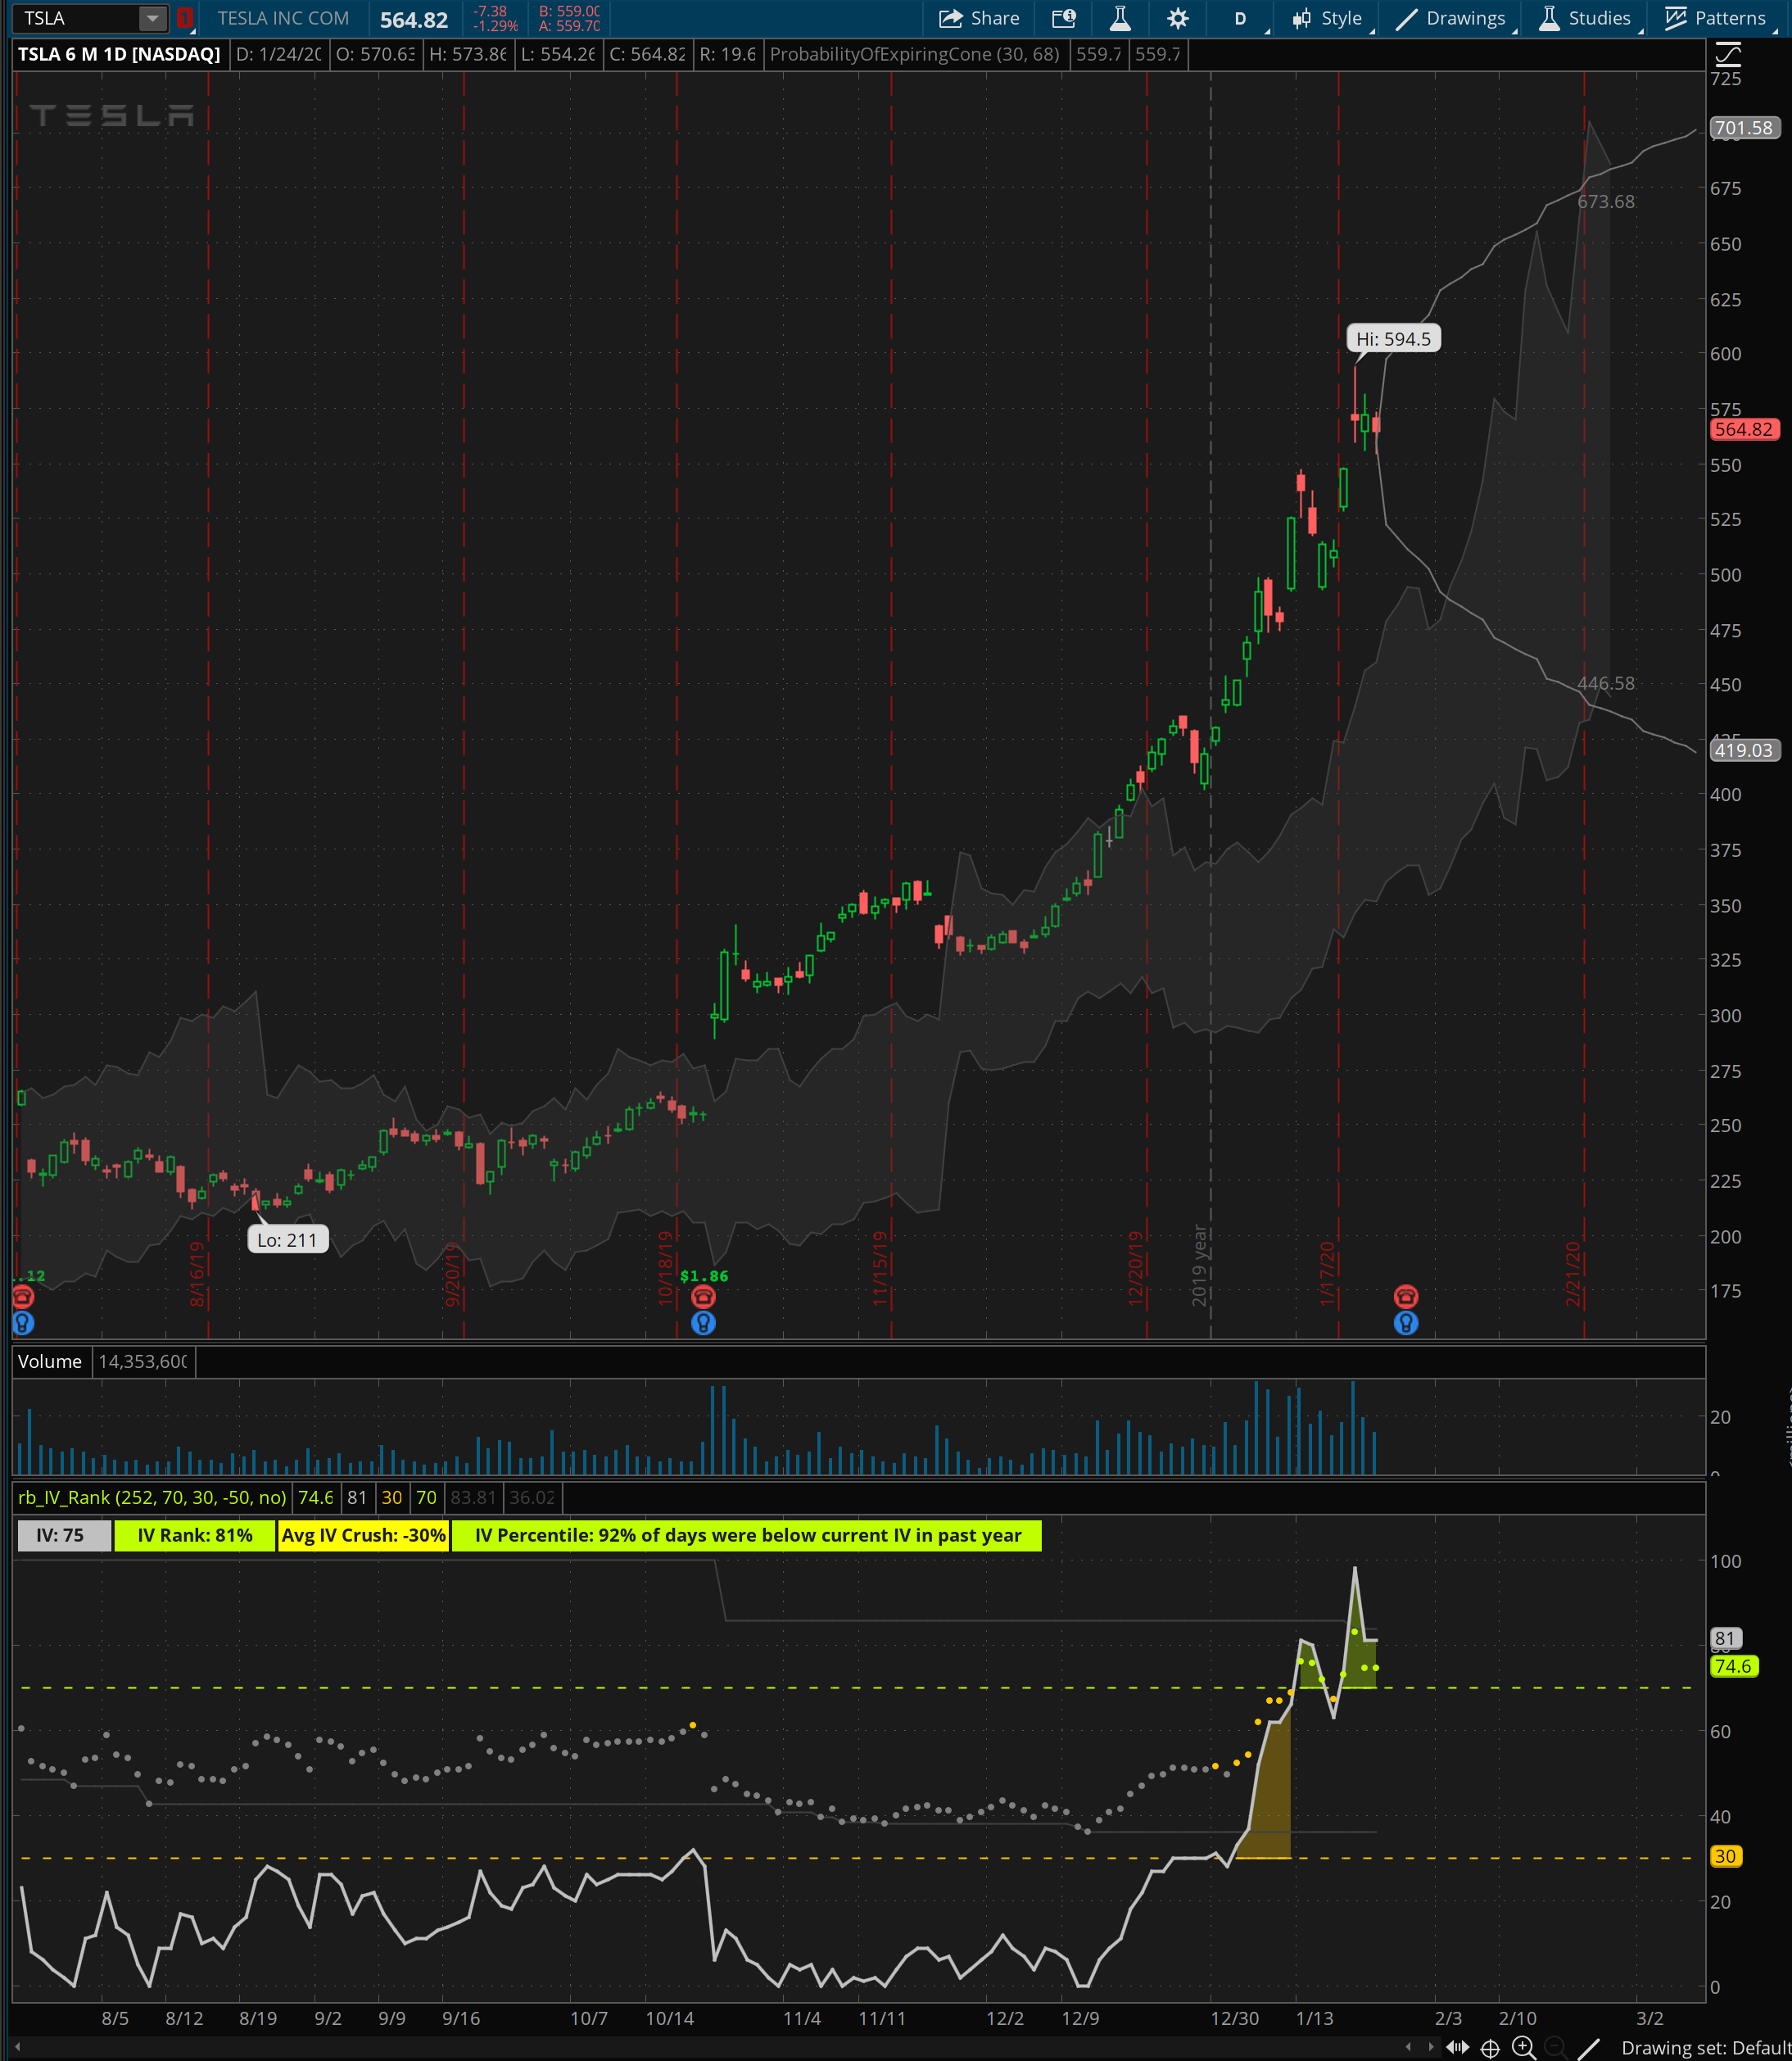
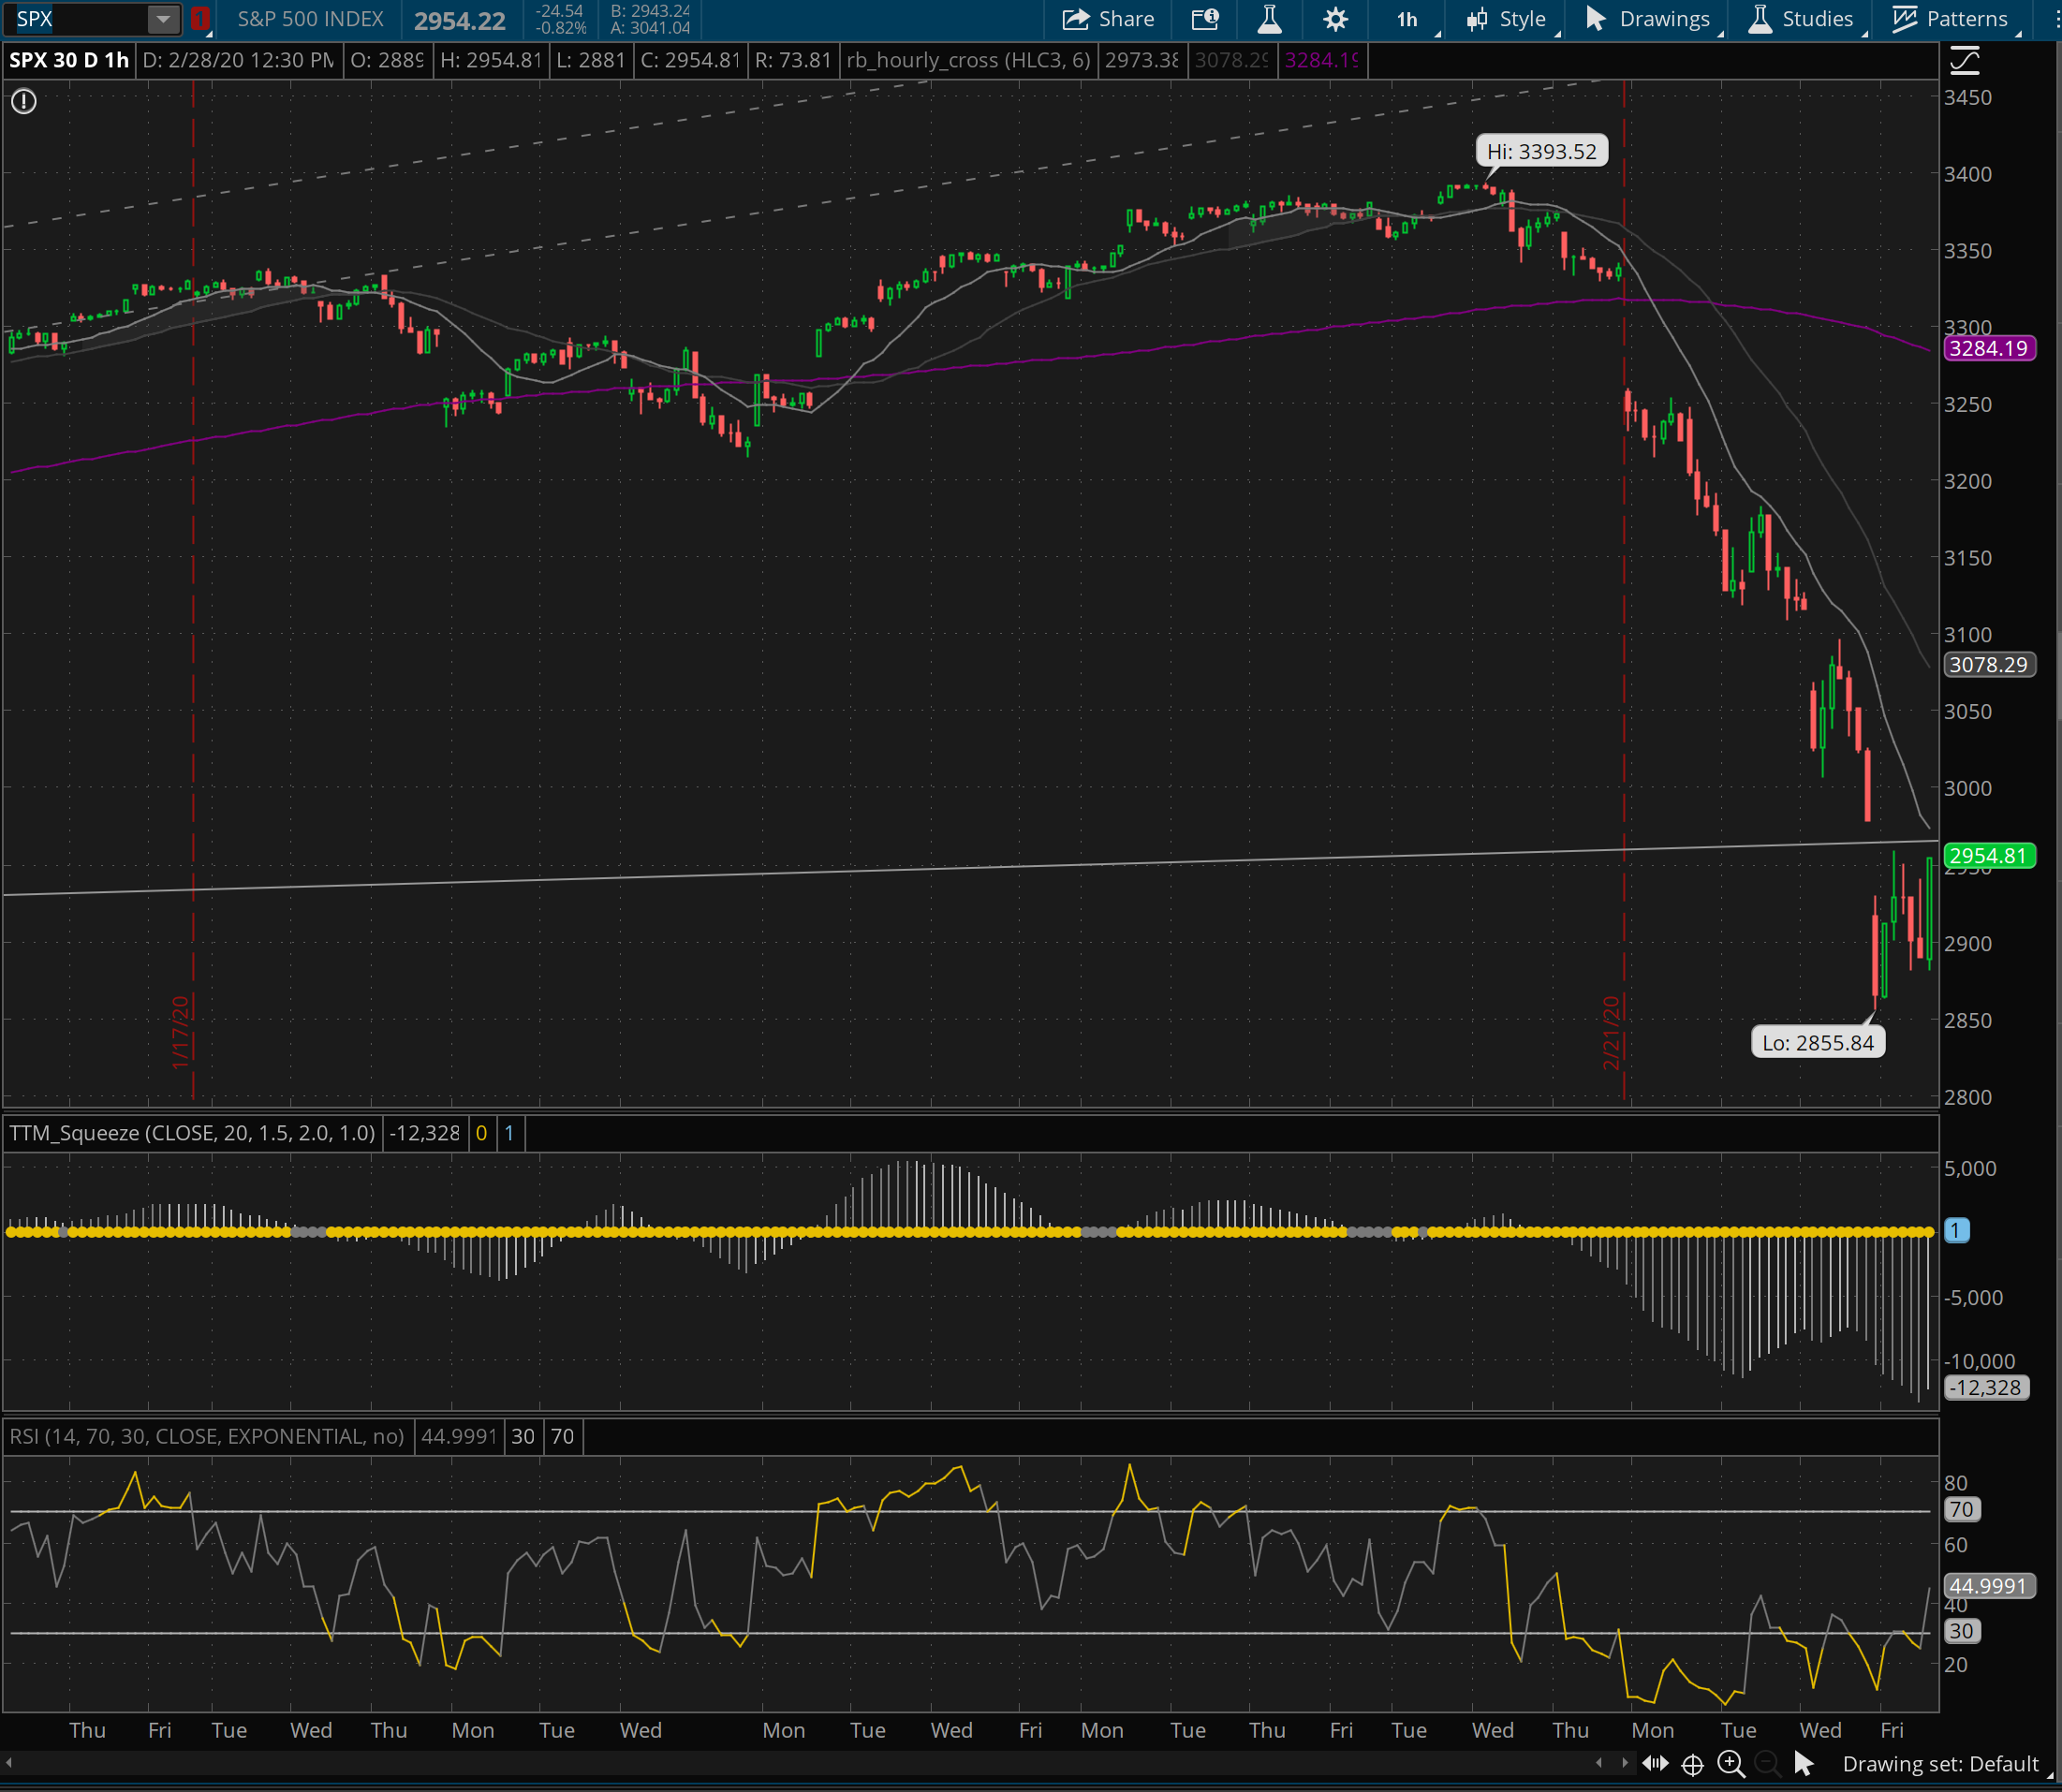
This past week we witnessed the most significant market selloff since 2008. The major indexes are all down more than 10% – straight down more than 10%. Vol was “bid” all week and we just barely got into oversold territory by the end of the week. The charts below show just how dramatic the move was, and the extreme vol spike that followed.

SPX 1 Year Chart

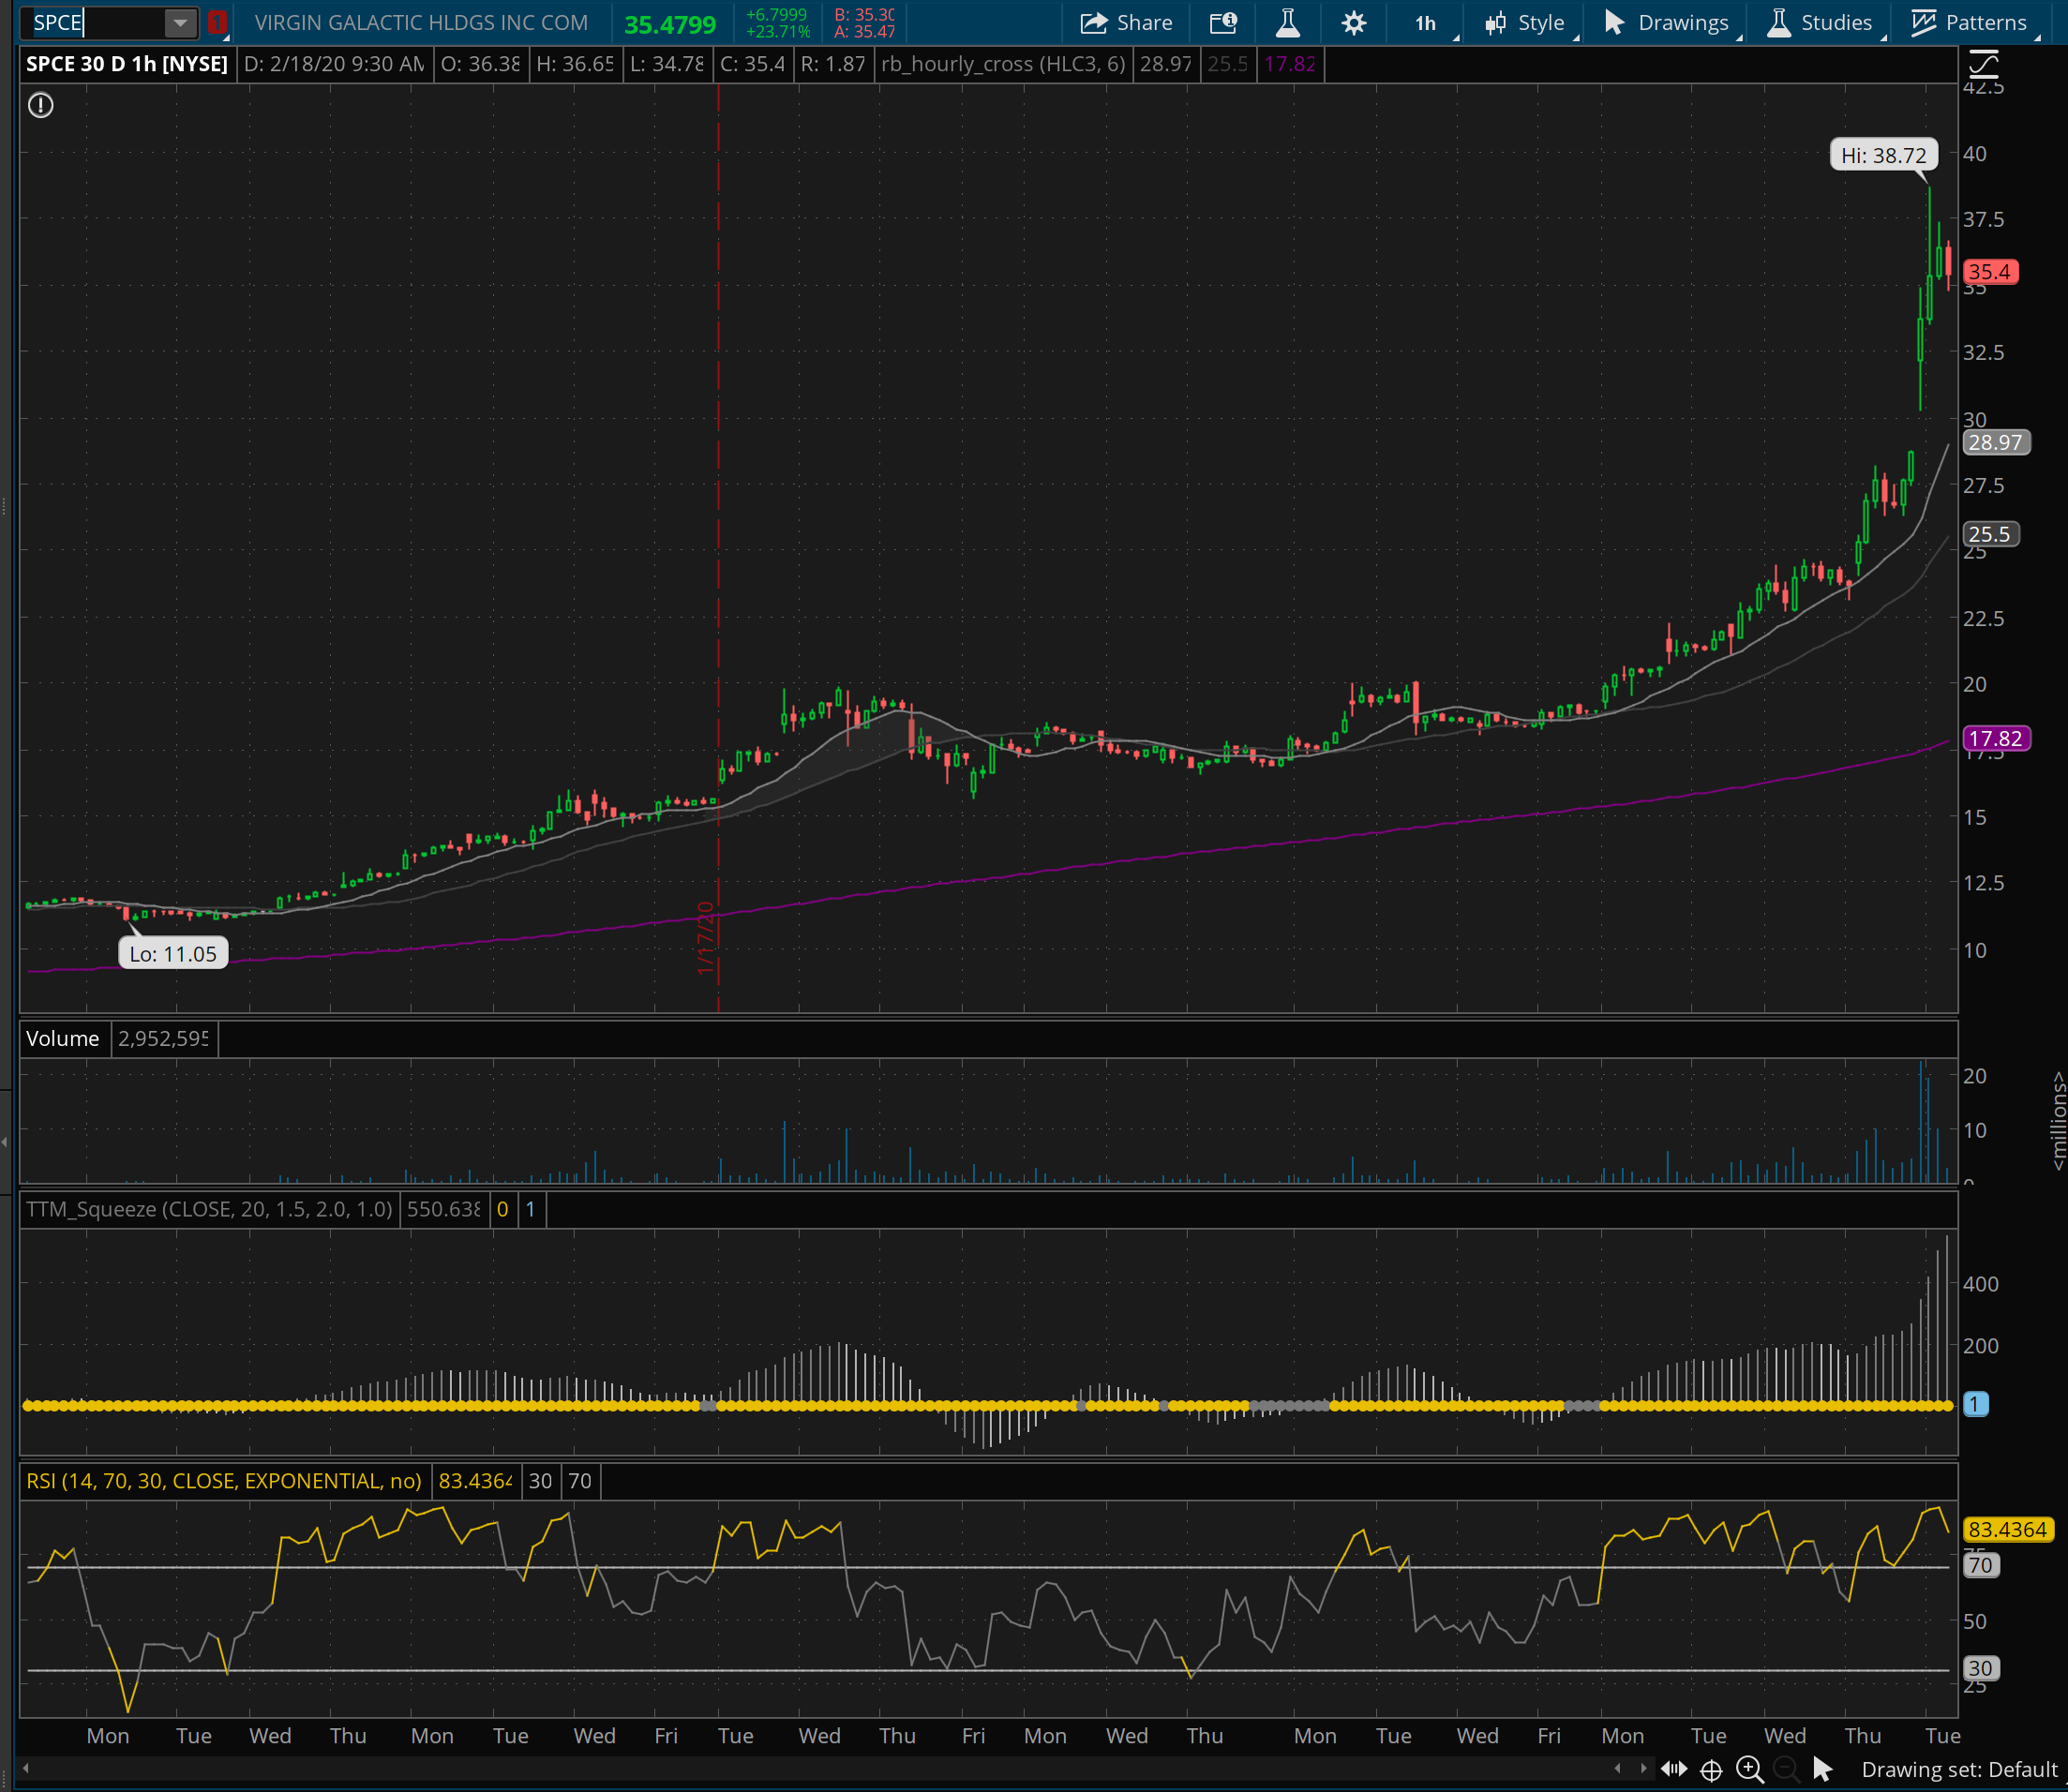
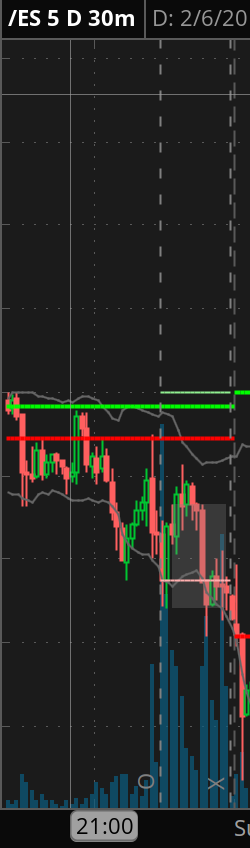
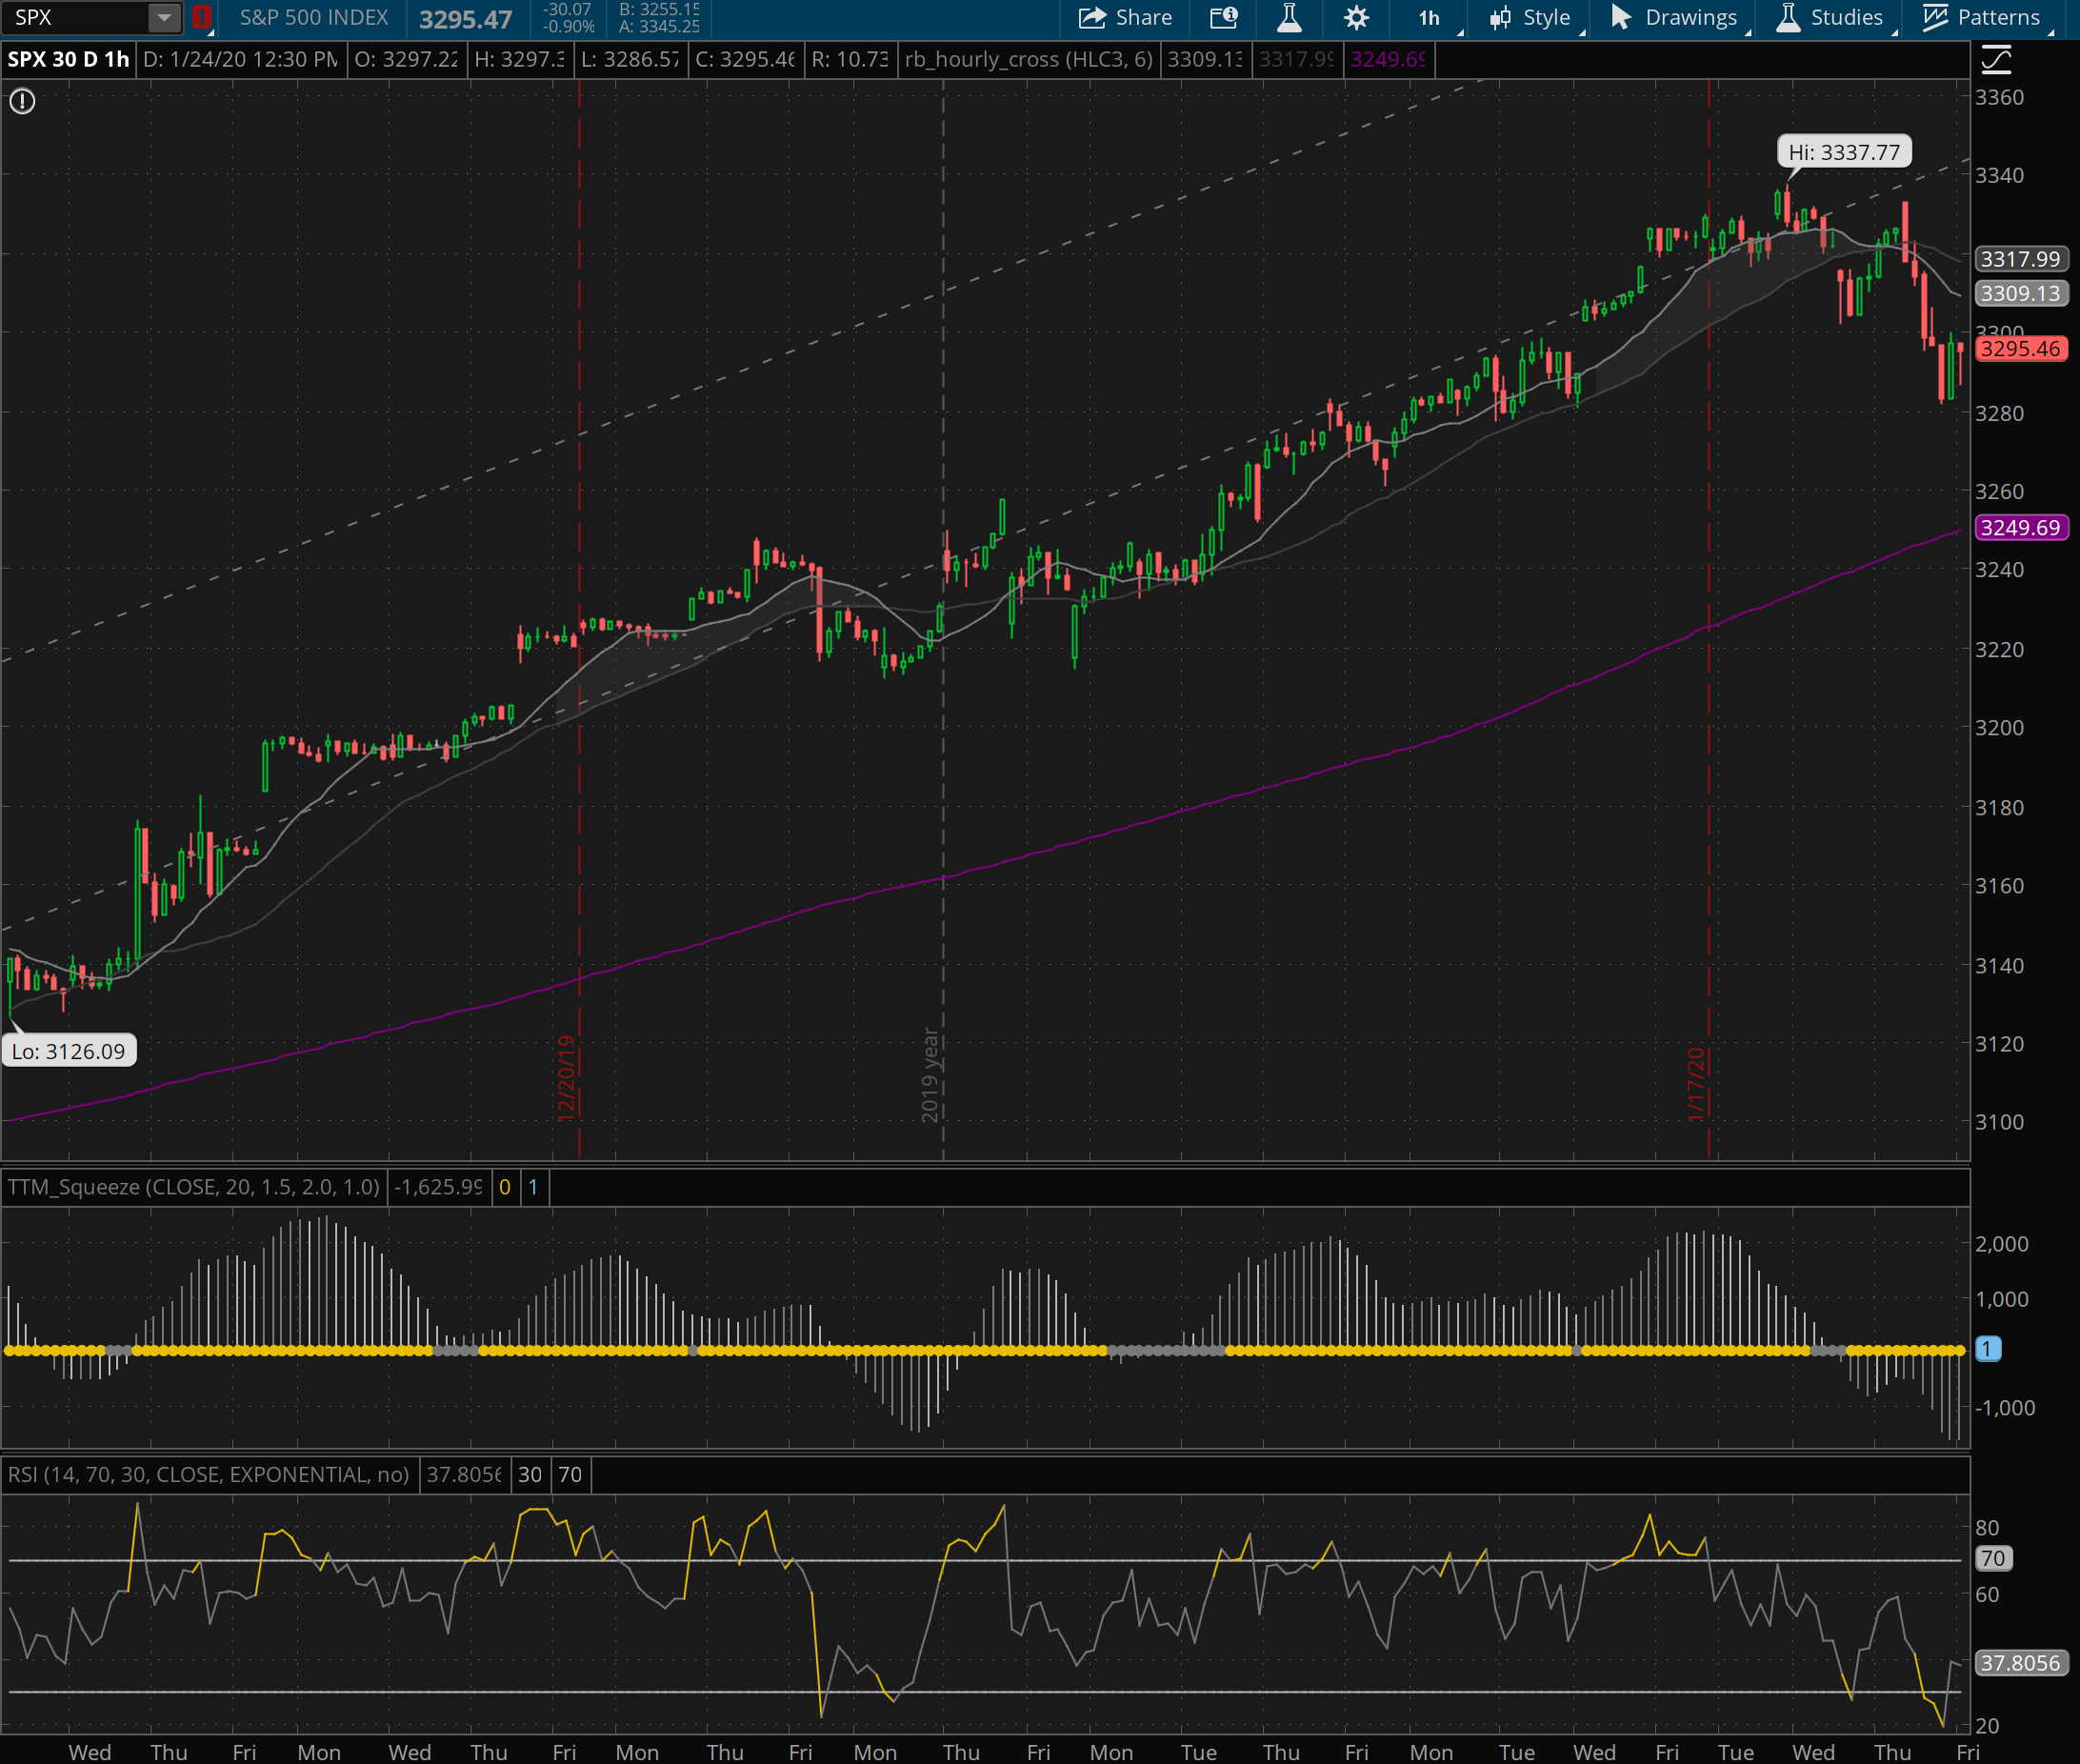
It was a weird week. The selling was fast, and consistent and unexpectedly directional. By that, I mean that typically when we see these types of events they whip around a bit, this was just a rapid orderly down move. Honestly, I’m still a bit shocked. The hourly chart below shows how it just drove down, basically straight down. The overnight session had massive moves this week as well, with some very choppy tape.

SPX 1 Hour Chart

For me, it was really a tale of two tapes. I’ve made no secret of my expectation that the markets are coming down. I’ve been short and loading up on shorts and Monday was a great day for me. However, I exited my positions very early in the week and started to load up on short vol and long delta.

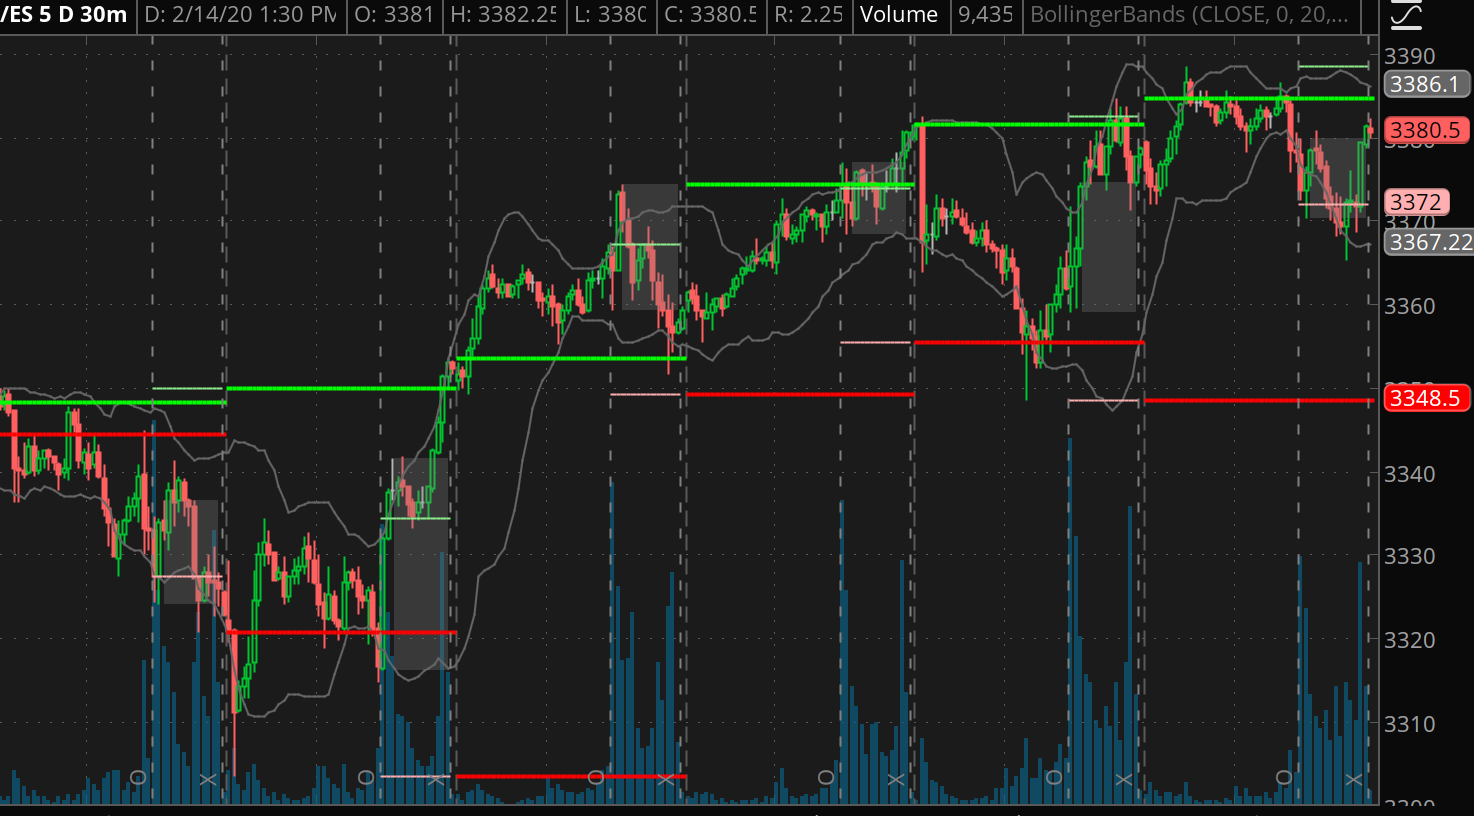
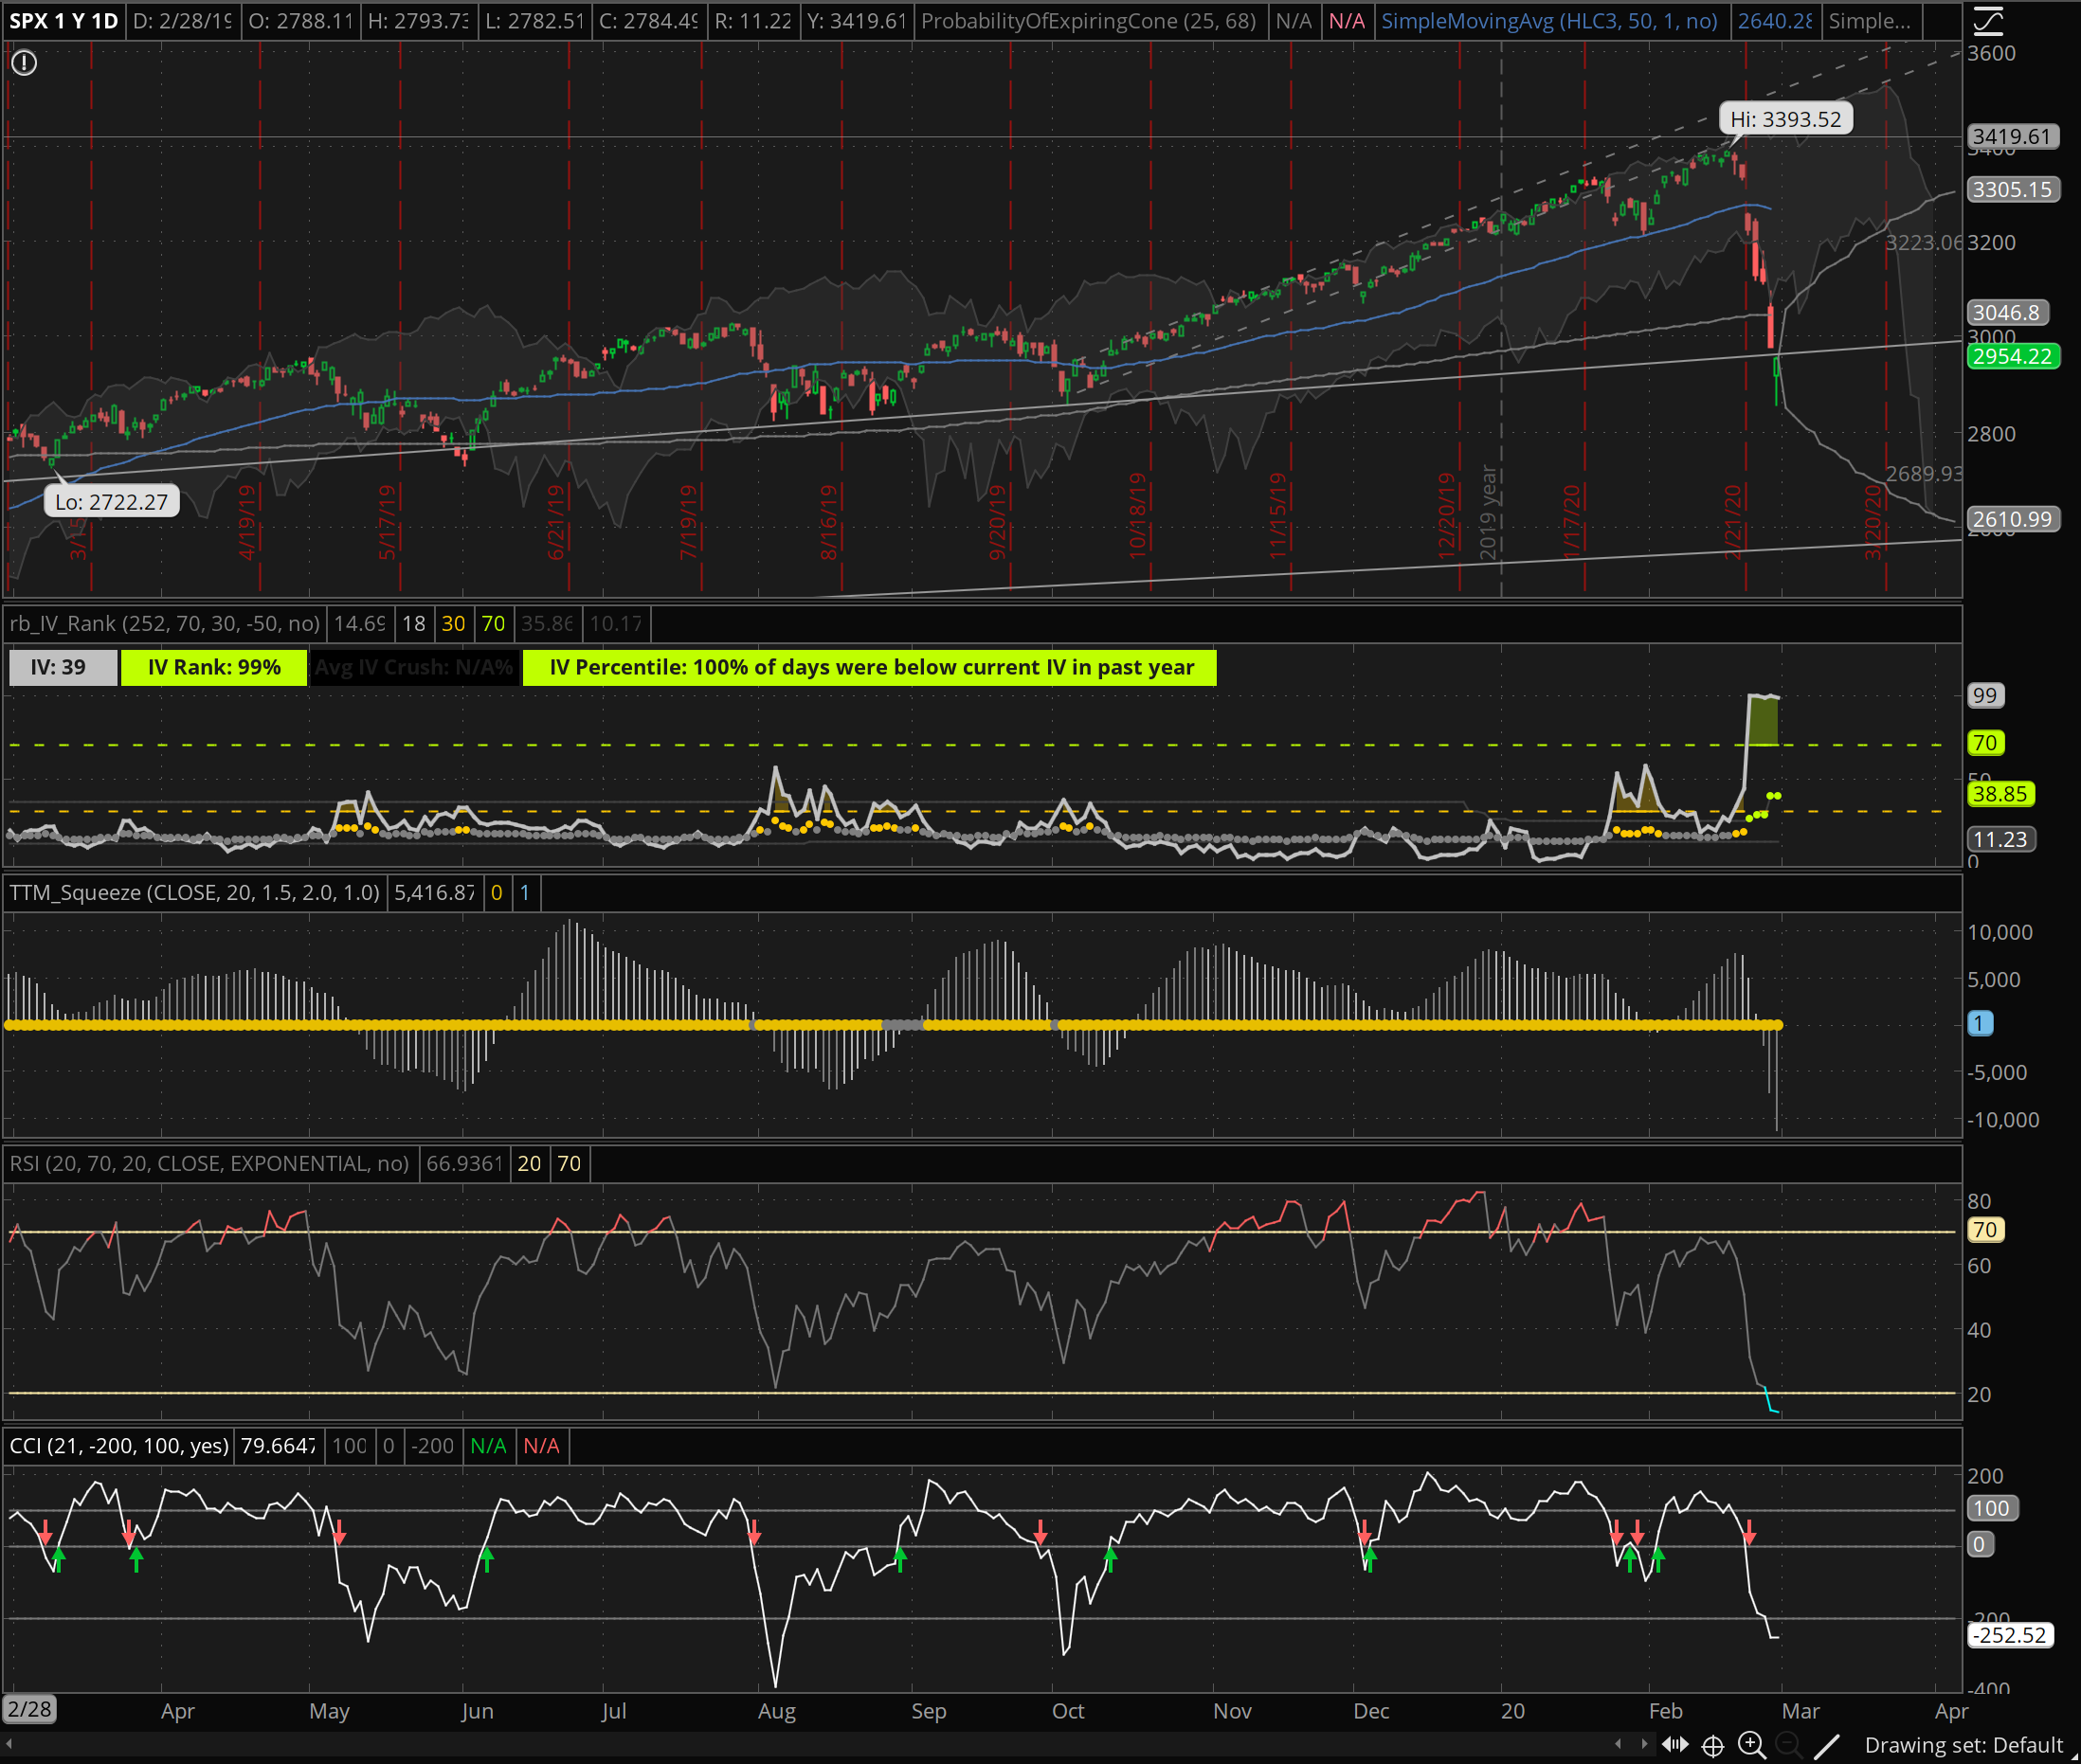
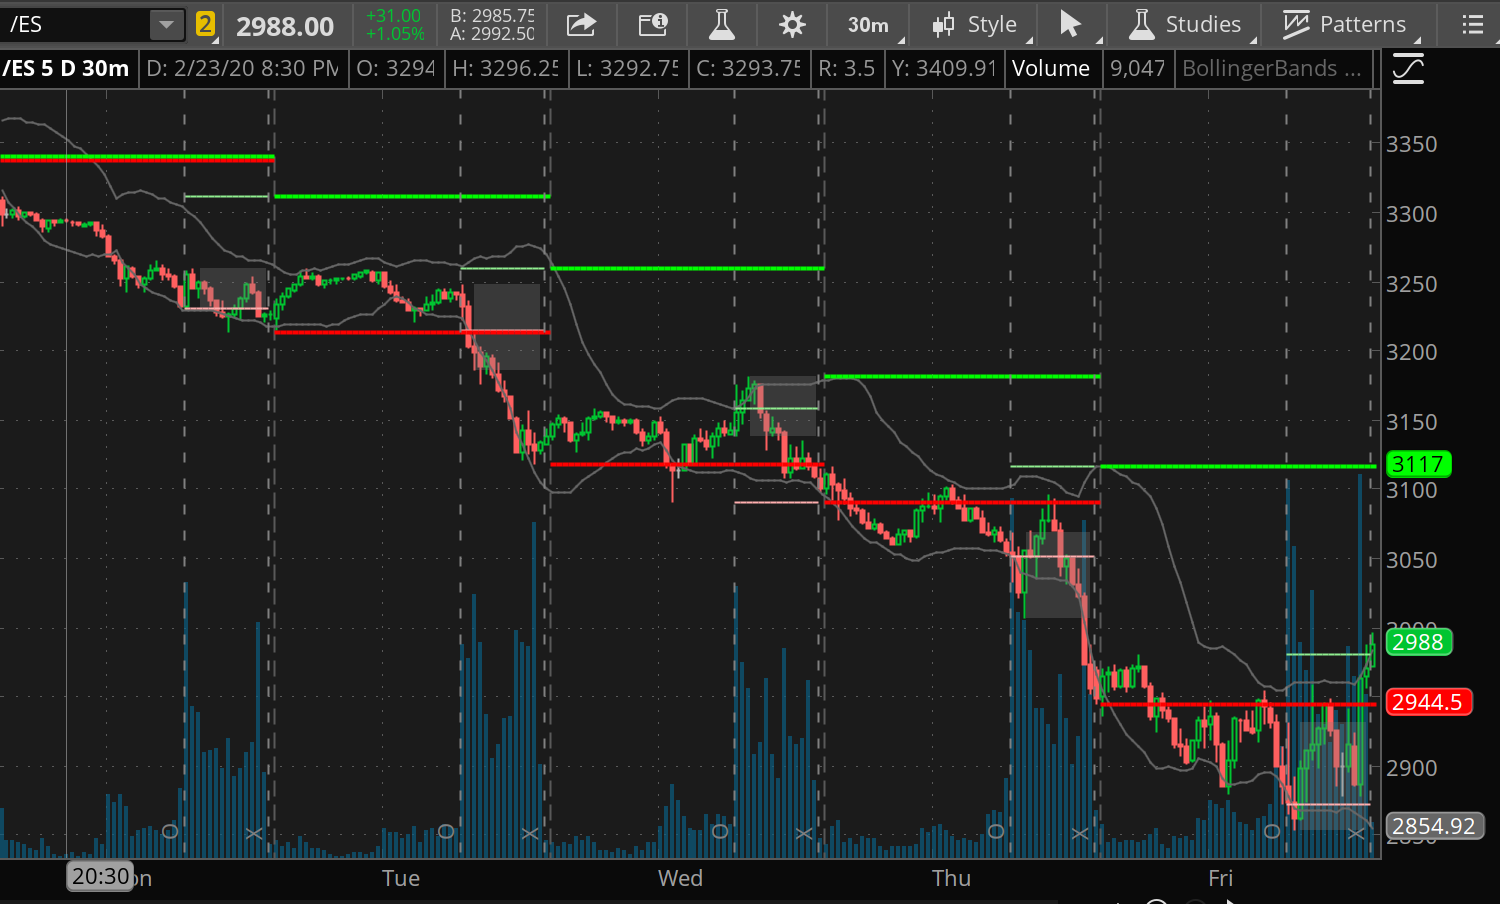
I really started to load up on Wednesday when the market appeared (for a brief moment) that it was poised to bounce a bit. This was a doubling down on short vol, and then getting long a tremendous amount of delta via /ES futures. You can see what appears to be a nice bottoming over night with some a nice push higher and a push higher on volume at the open Wednesday. I read this as the market being poised for a brief recovery…

Early week /ES Chart

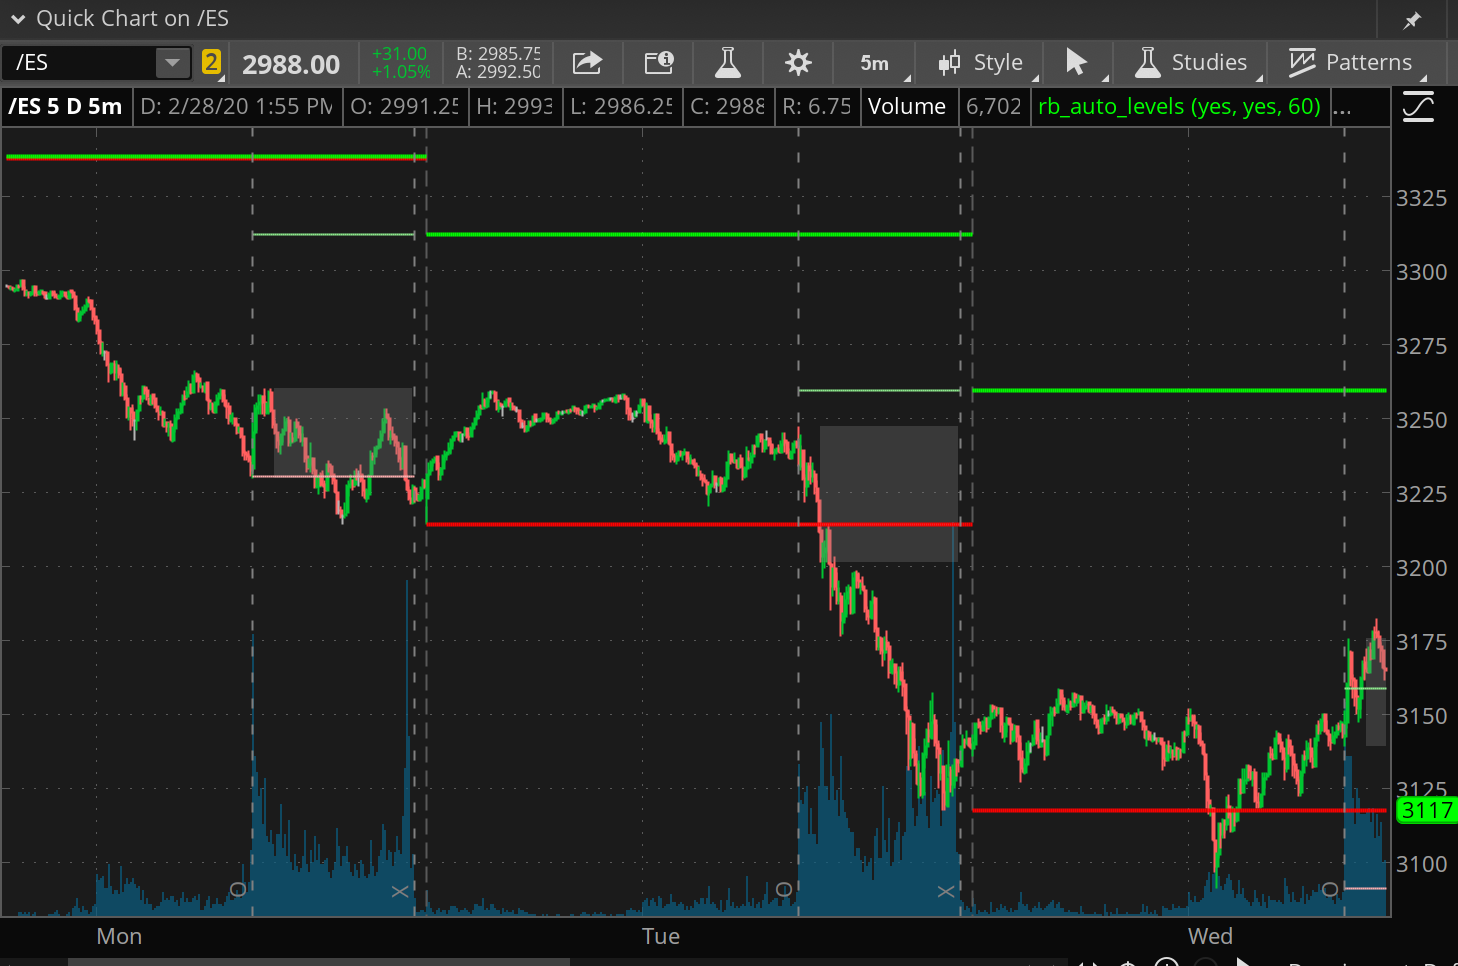
Those two positions, short vol and long delta worked against me in a material way this week and by the end of the week I had blown through all of the weekend profits and realized some pretty sizable losses due to the amount of long static delta (ie: futures) I was holding. Looking at the chart below, you can see the brief recovery on Wednesday, and then the intensity of selling that followed the close.

Weekly 30min chart of /ES

Note: None of the losses I incurred this week are insurmountable or something that I am not prepared to incur. You must always manage your risk and relative position size. My losses relative to my portfolio risk profile are less than the market movement, however my expectation was to out perform dramatically given the action of the market this week.

I’m pretty disappointed in my performance this week; but am happy that I hedged my longer term investment accounts into a very conservative position before this drop began. Overall, it’s a win for the good kids (as they say on tastytrade) but it wasn’t a win for my speculative accounts – bummer.

I have a handful of positions that simply got crushed this week. Most of my put spreads have been breached on both strikes and I’ve been defensively selling call spreads to offset the exposure or rolling out in duration where possible to allow the market to take a breather and allow theta to work its magic.

My short term perspective on this market remains bearish. I’m still shocked that we haven’t seen a fierce up day given the massive downside movement; however I’m not interested in trying to speculate on that during this type of price action any longer.

It’s tough to be a trader when you have a full time job, and that really hurt me this week as I have to have a set it and forget it attitude for a large portion of the trading day.

Intermediate term, I expect we’ll be in a depressed earning cycle for the next couple of quarters (even if the COVID-19 outbreak doesn’t become a true pandemic like Spanish Flu or something similar). The panic and physical changes that we are making in relation to that panic: shutting down factories, stopping travel etc… are going to put a real damper on demand and supply. For those of you with an economics background, you understand how bad of a combo that is.

There may be real structural losses that will take years to recover depending on the severity of the demand/supply shocks.

The human toll of this virus is tragic, and my heart goes out to all of those affected.

In terms of a market outlook, I wouldn’t be surprised to see an additional grind downwards into a technical bear market. Given that I have an economics degree I’ll hedge that off and add the flip side that I also wouldn’t be surprised to see the market continue rally from this point and recoup a large degree of the losses. πŸ™‚

As for current positions, here is what I’m dealing with right now:

AAL – Short 2 Different Put Spreads March 6th 18/17 and March 19/18

AAL Chart

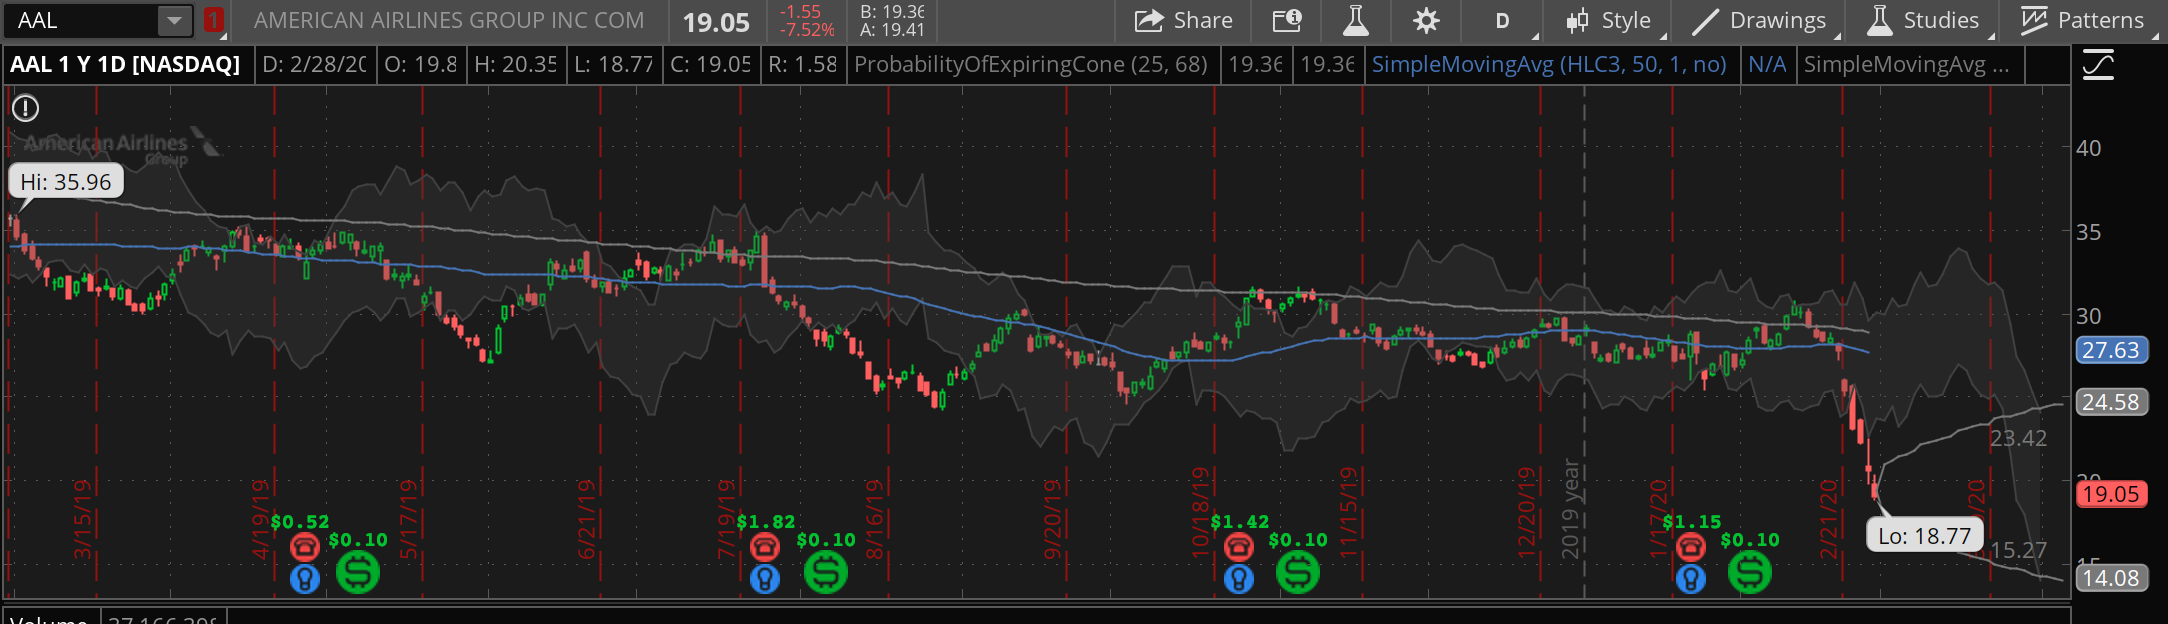
I mean, it’s certainly possible that American Airlines can go lower; but it has basically been destroyed with the recent sell off. I will very likely keep selling these types of positions on travel related stocks with short term duration for a while.

This trade has moved against me – because I put it on on Wednesday…. I could have sold it for 2x what I did then. Oh well πŸ™‚

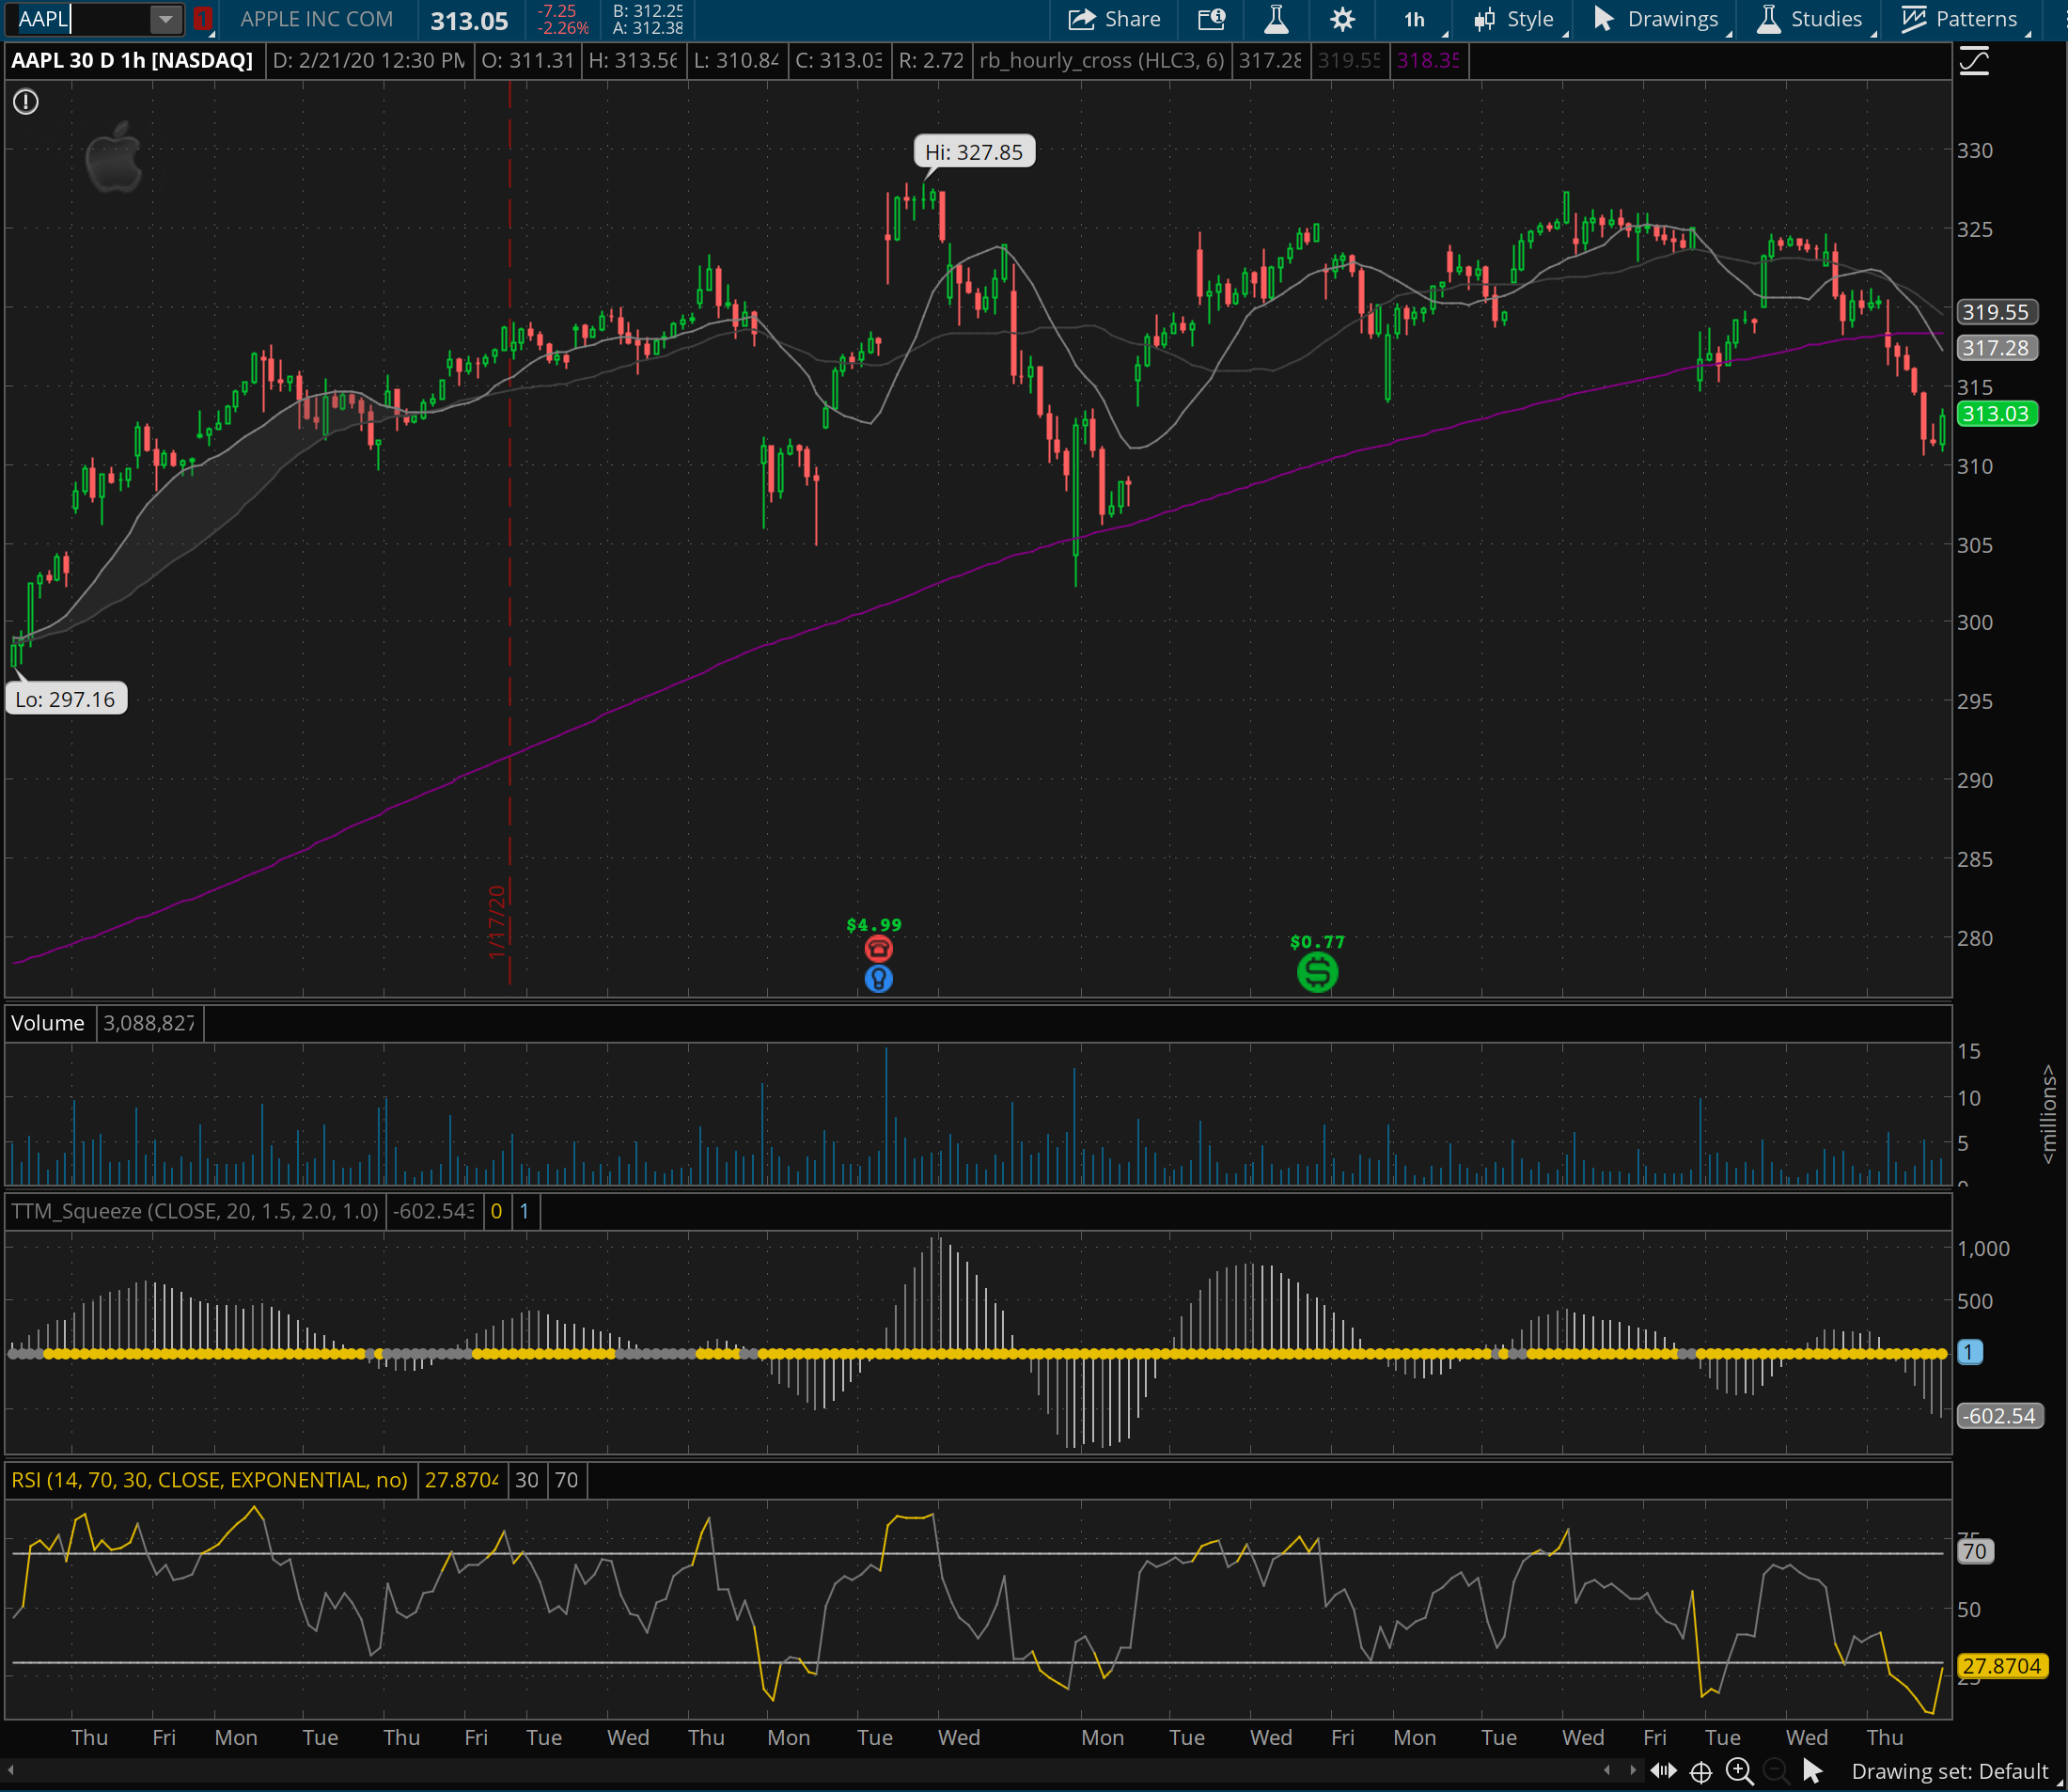
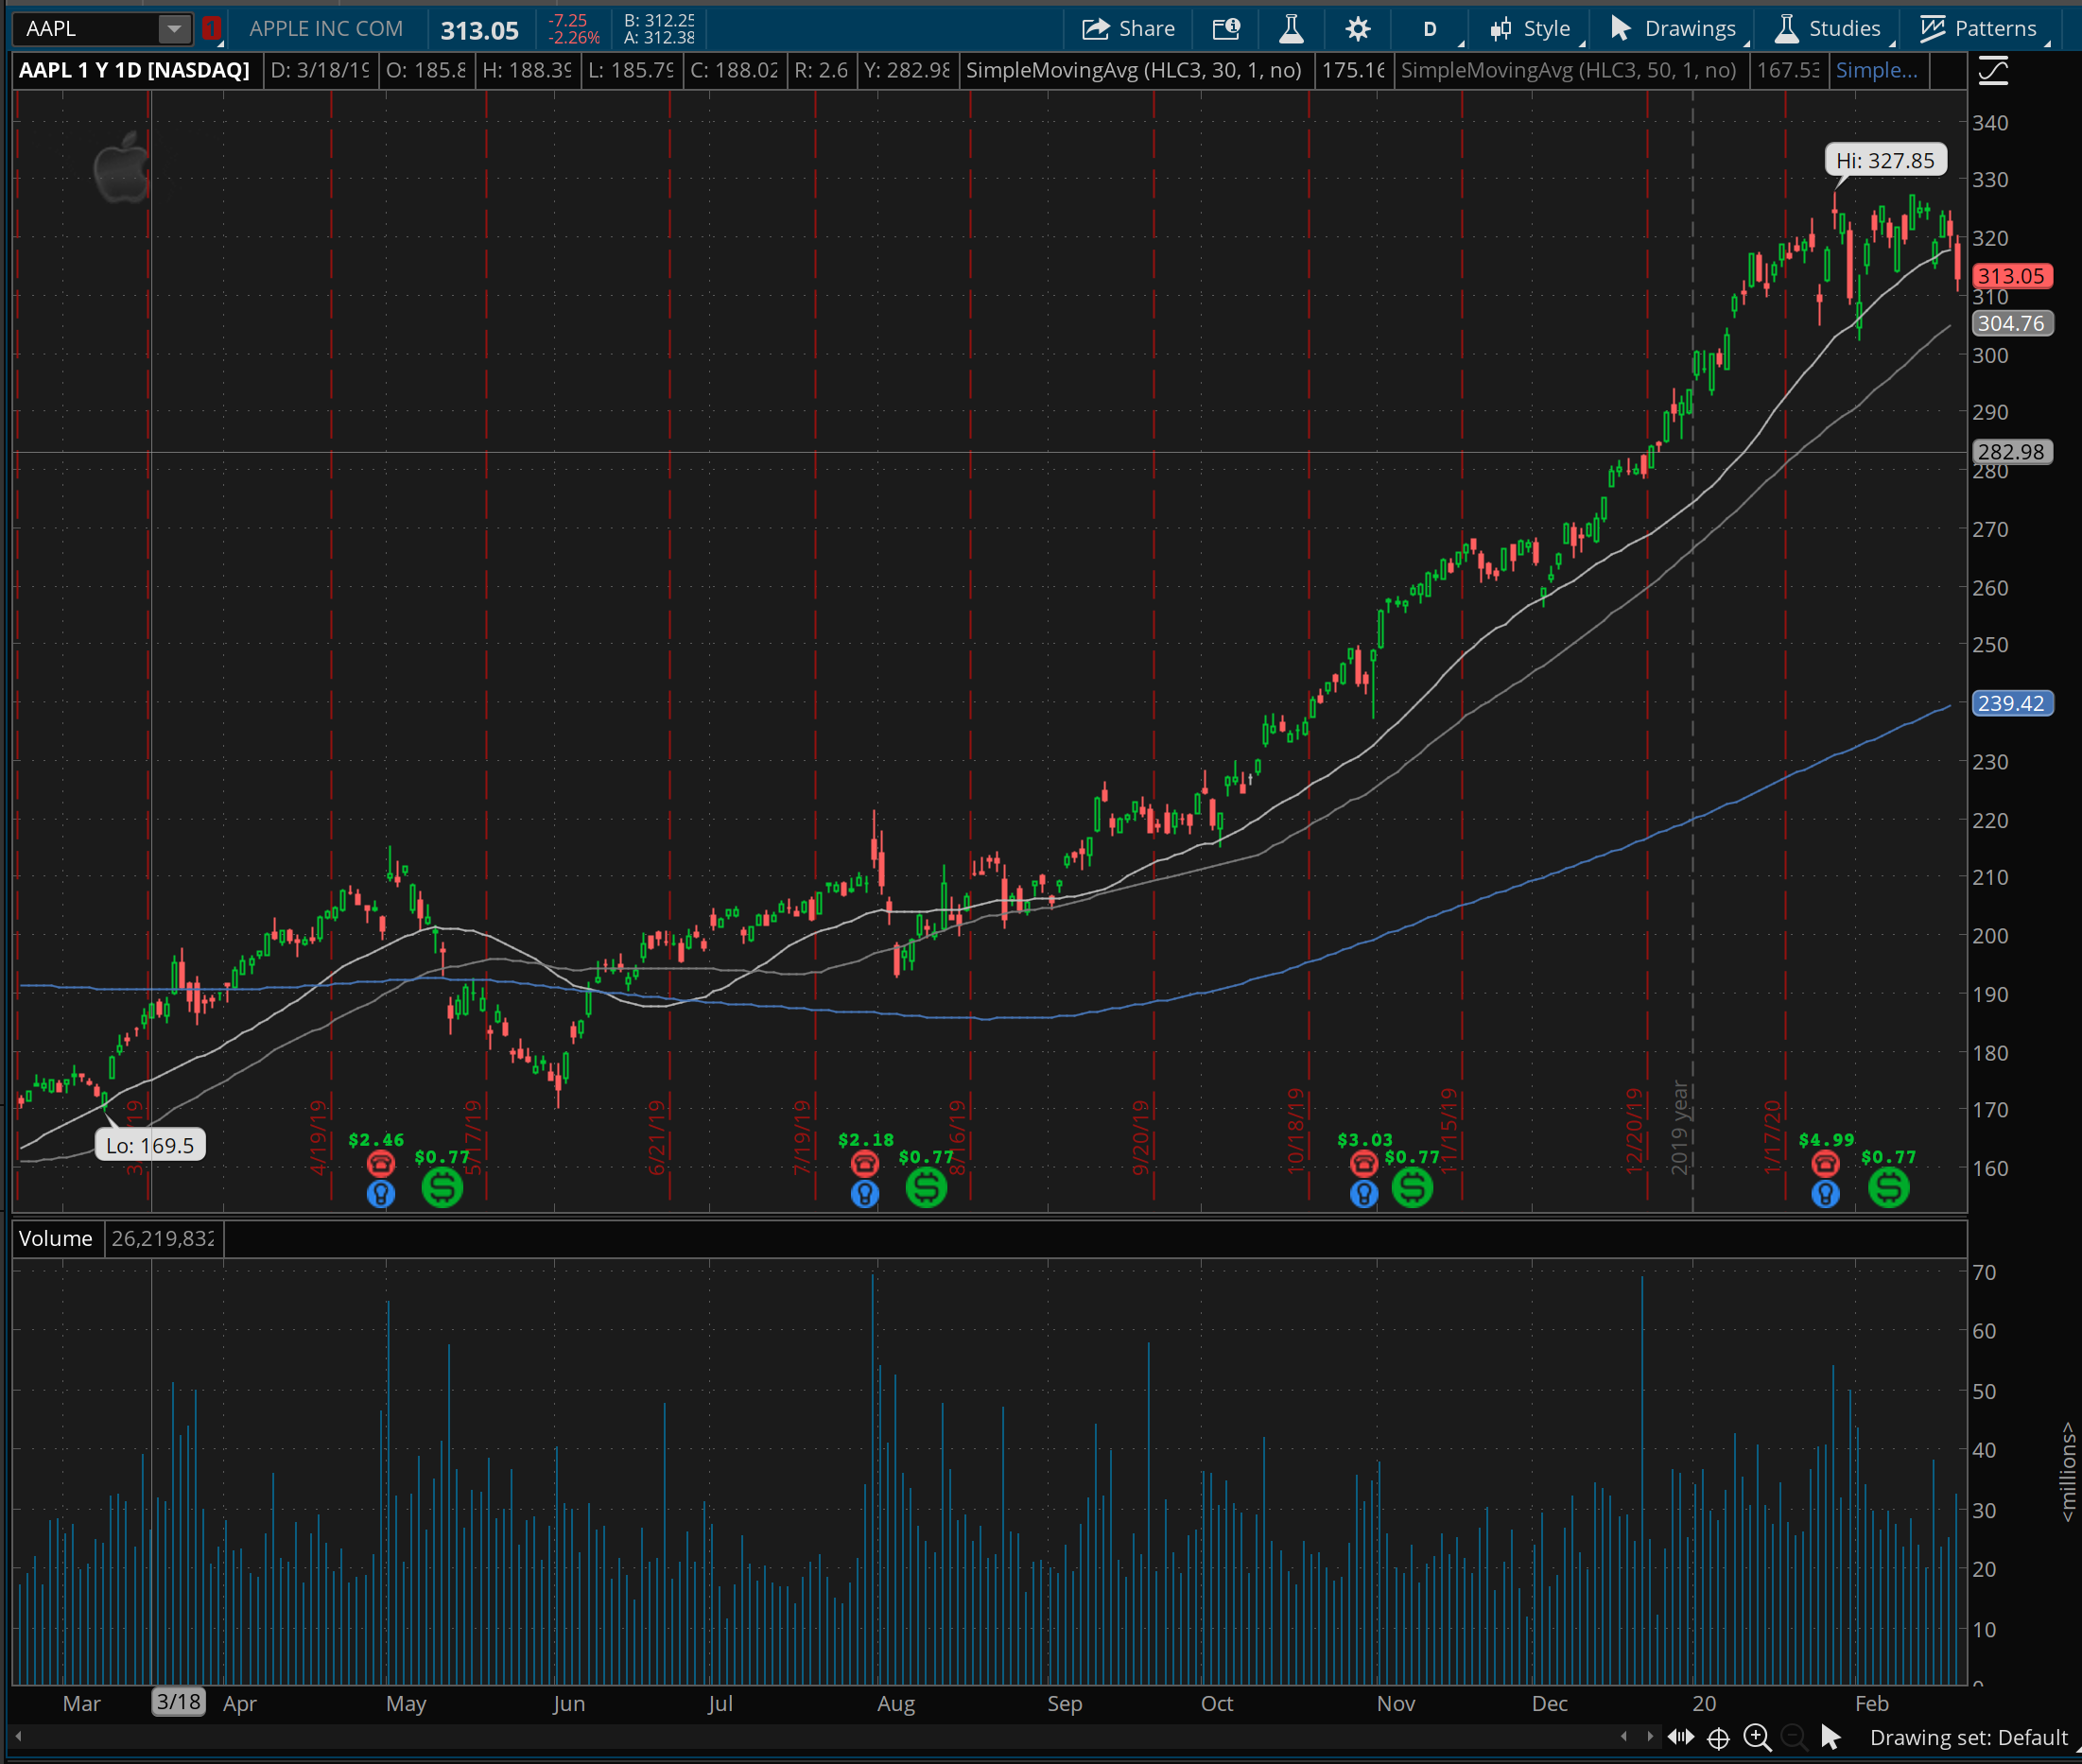
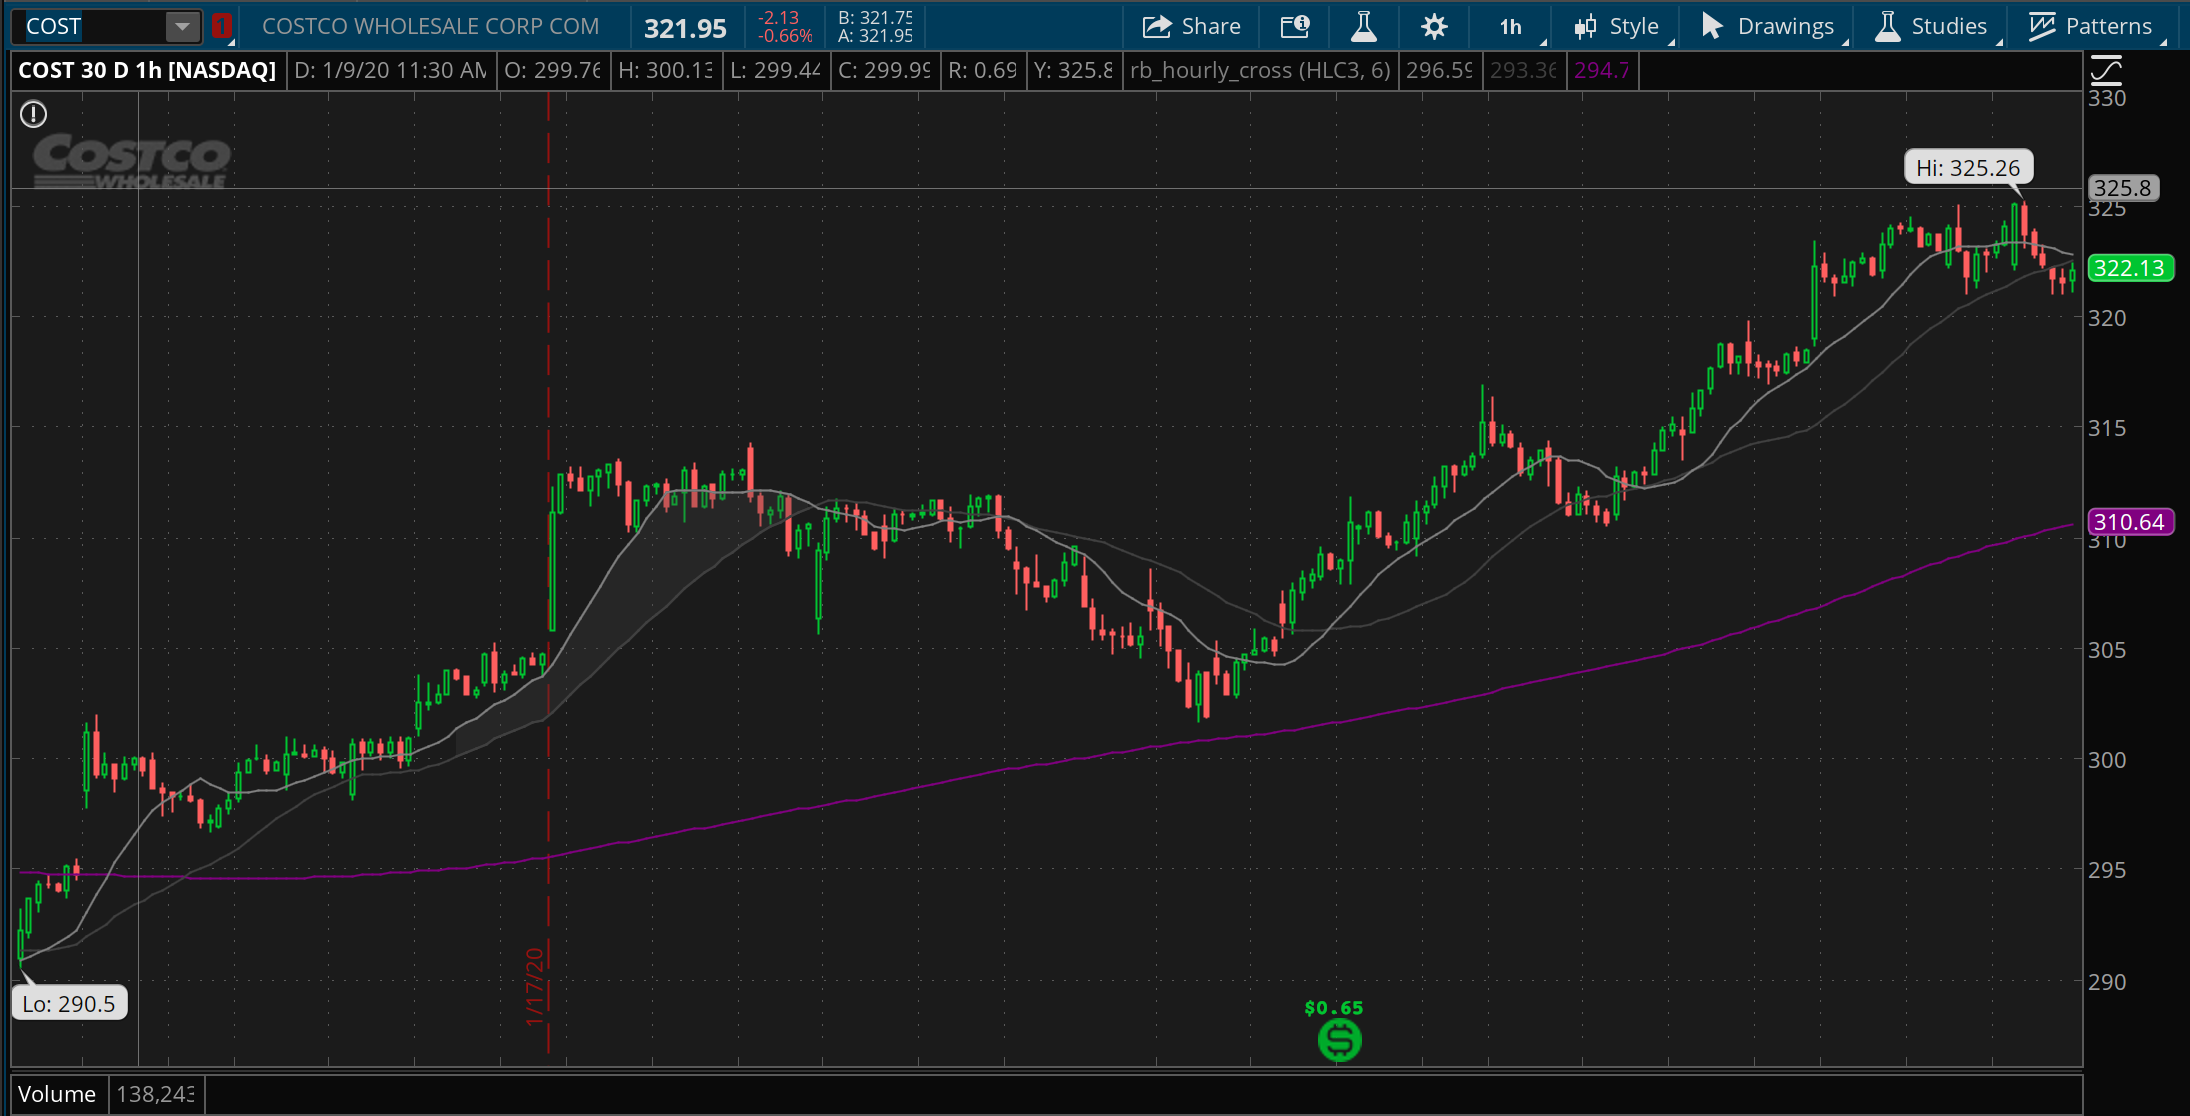
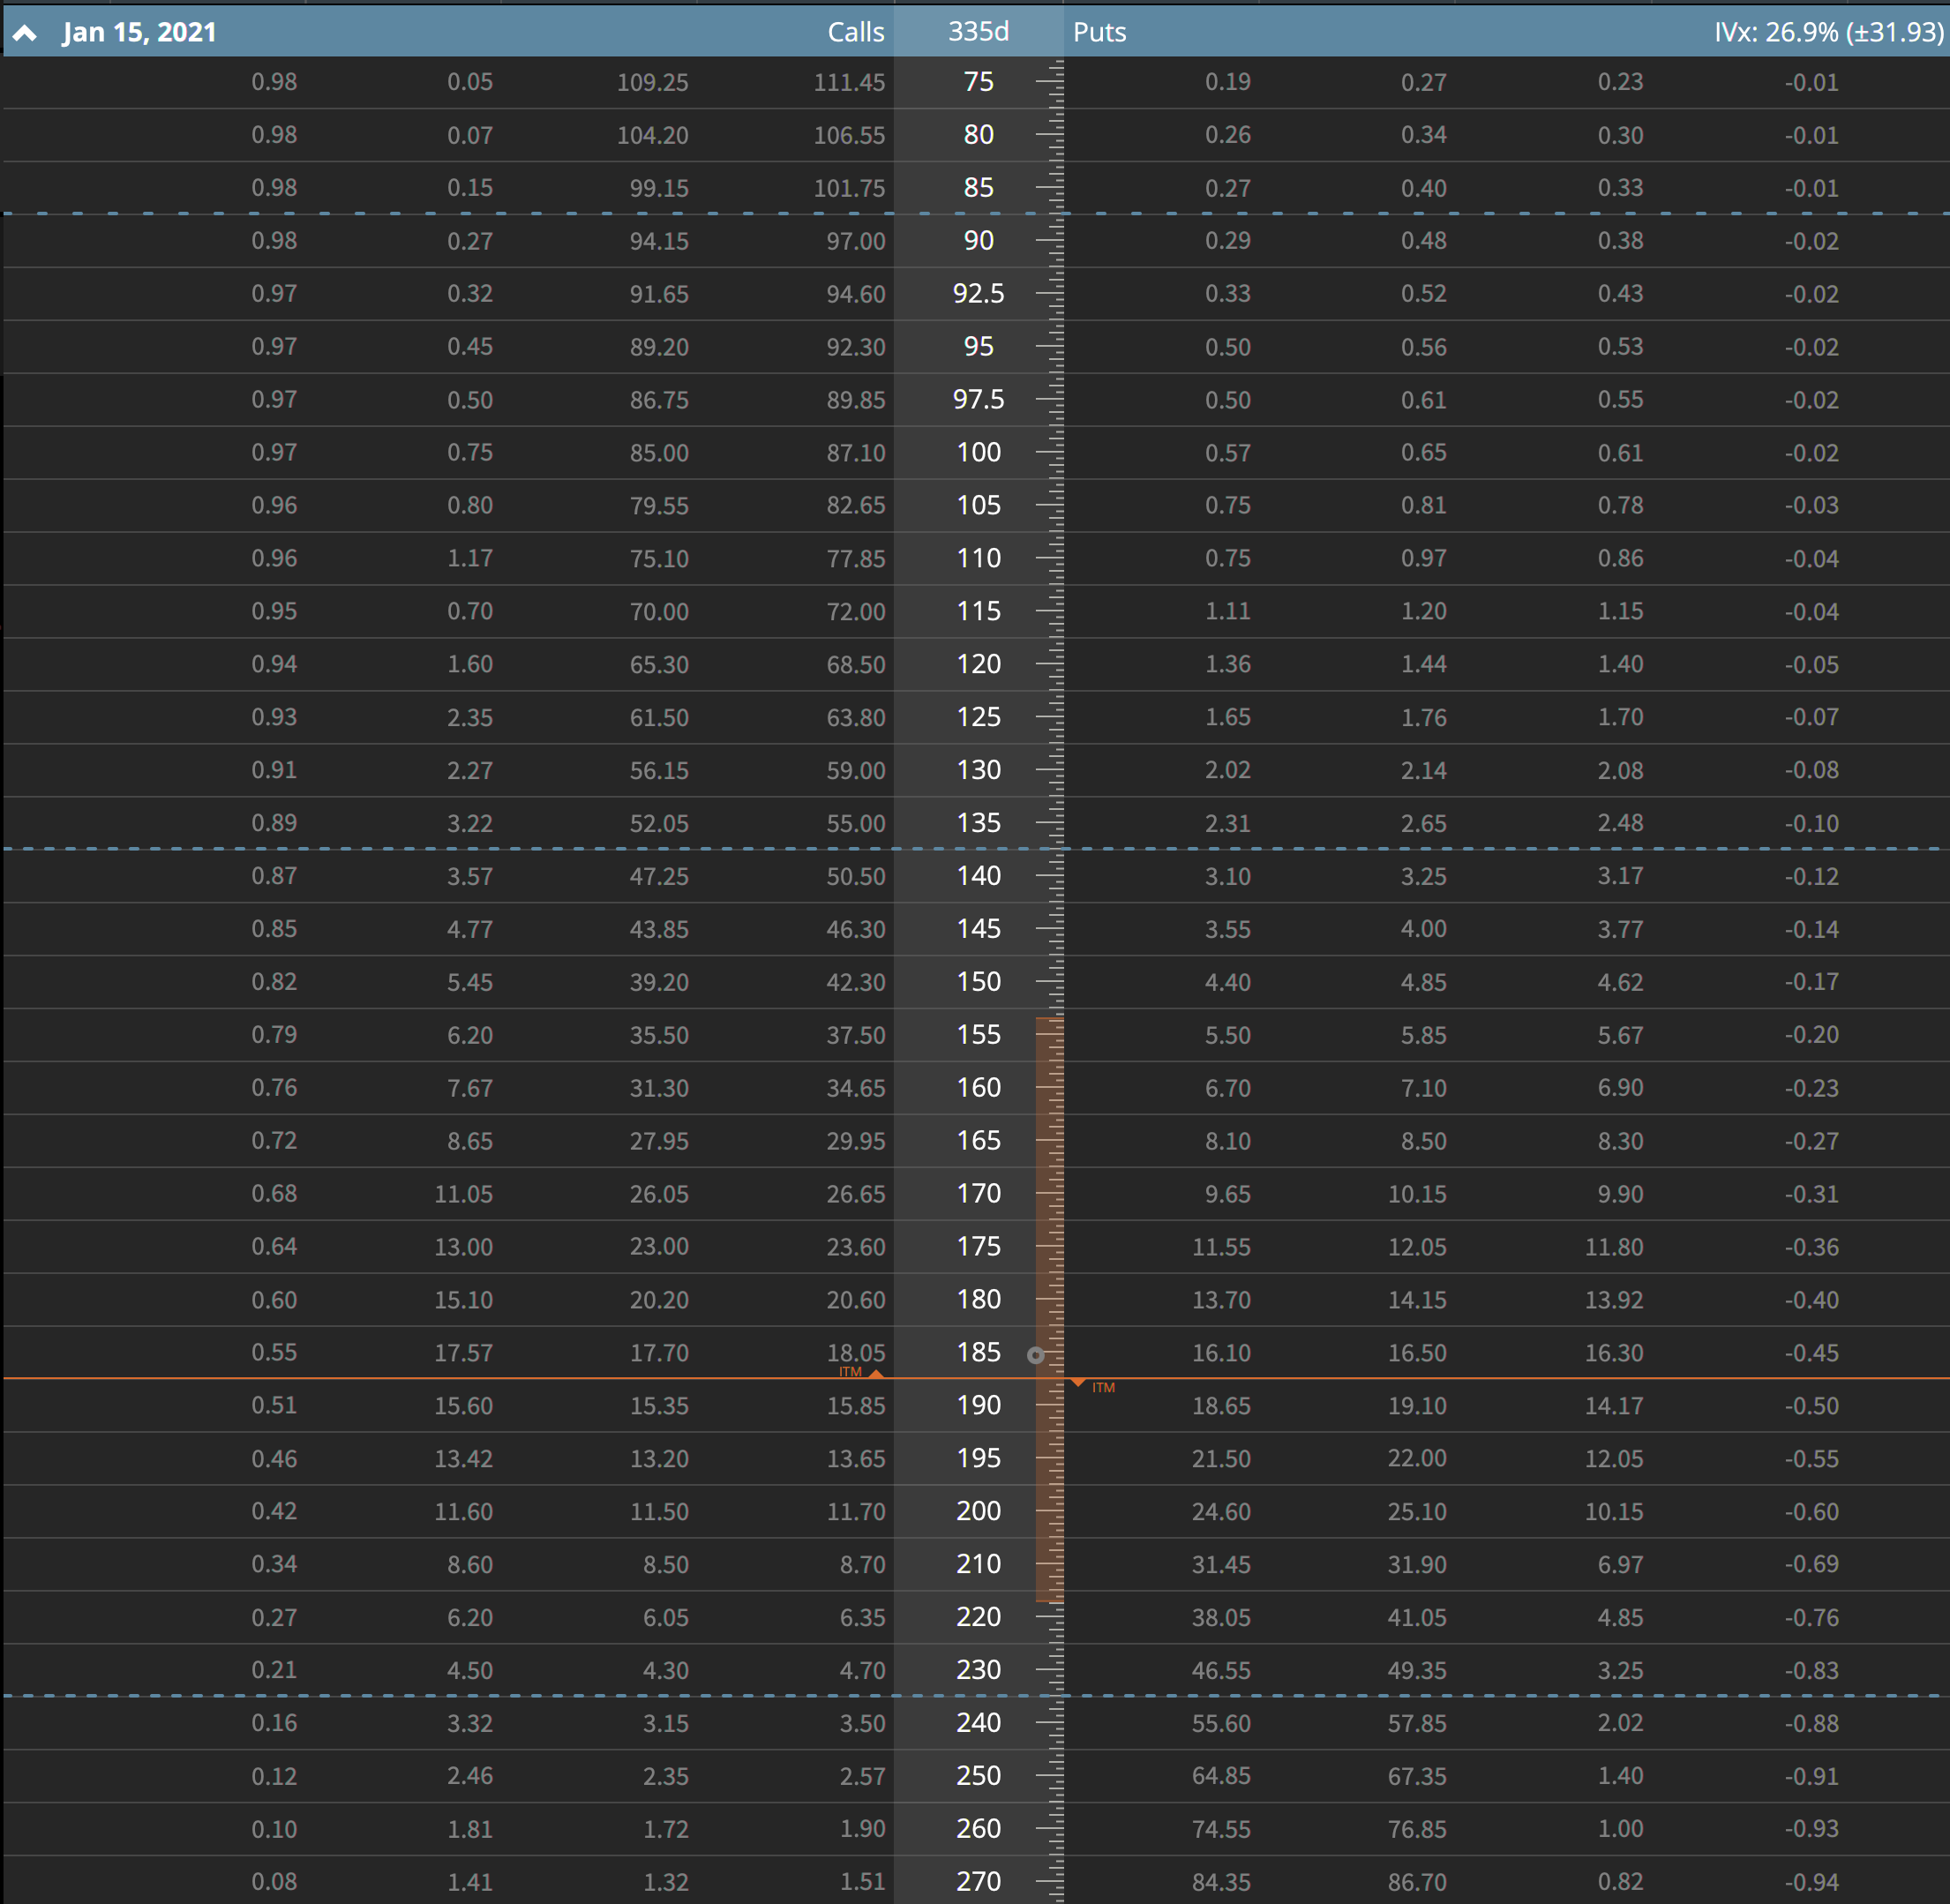
AAPL – Short March 310/305 Put Spread and April 290/285 Put Spread

AAPL Chart

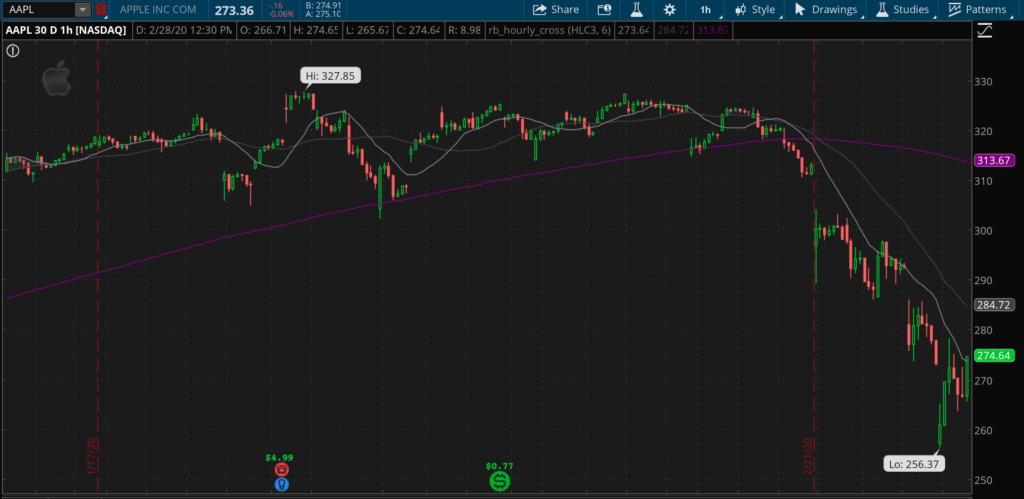
Apple completely fell out of bed this week. The hourly chart shows clearly how bad this performed during the sell off. I’m encouraged by the tape on Friday, and am really looking to see it move up over the next couple of weeks. The April position is one that I rolled out for a debit on Friday to get some more time. I’m hoping to roll the March position next week on a strong bounce from Apple – otherwise I’ll need to play some different defense.

This week I also sold a 305/310 call spread that expired Friday. Depending on the market action over the next week or so, I’ll continue to sell those shorter term spreads to capture some credits against these breached puts. On these defined risk type positions, I use that offsetting shorter duration spread as a tool to do something similar to going inverted on a strangle. It’s definitely not the same as inversion, and does create some different risks that need to be managed.

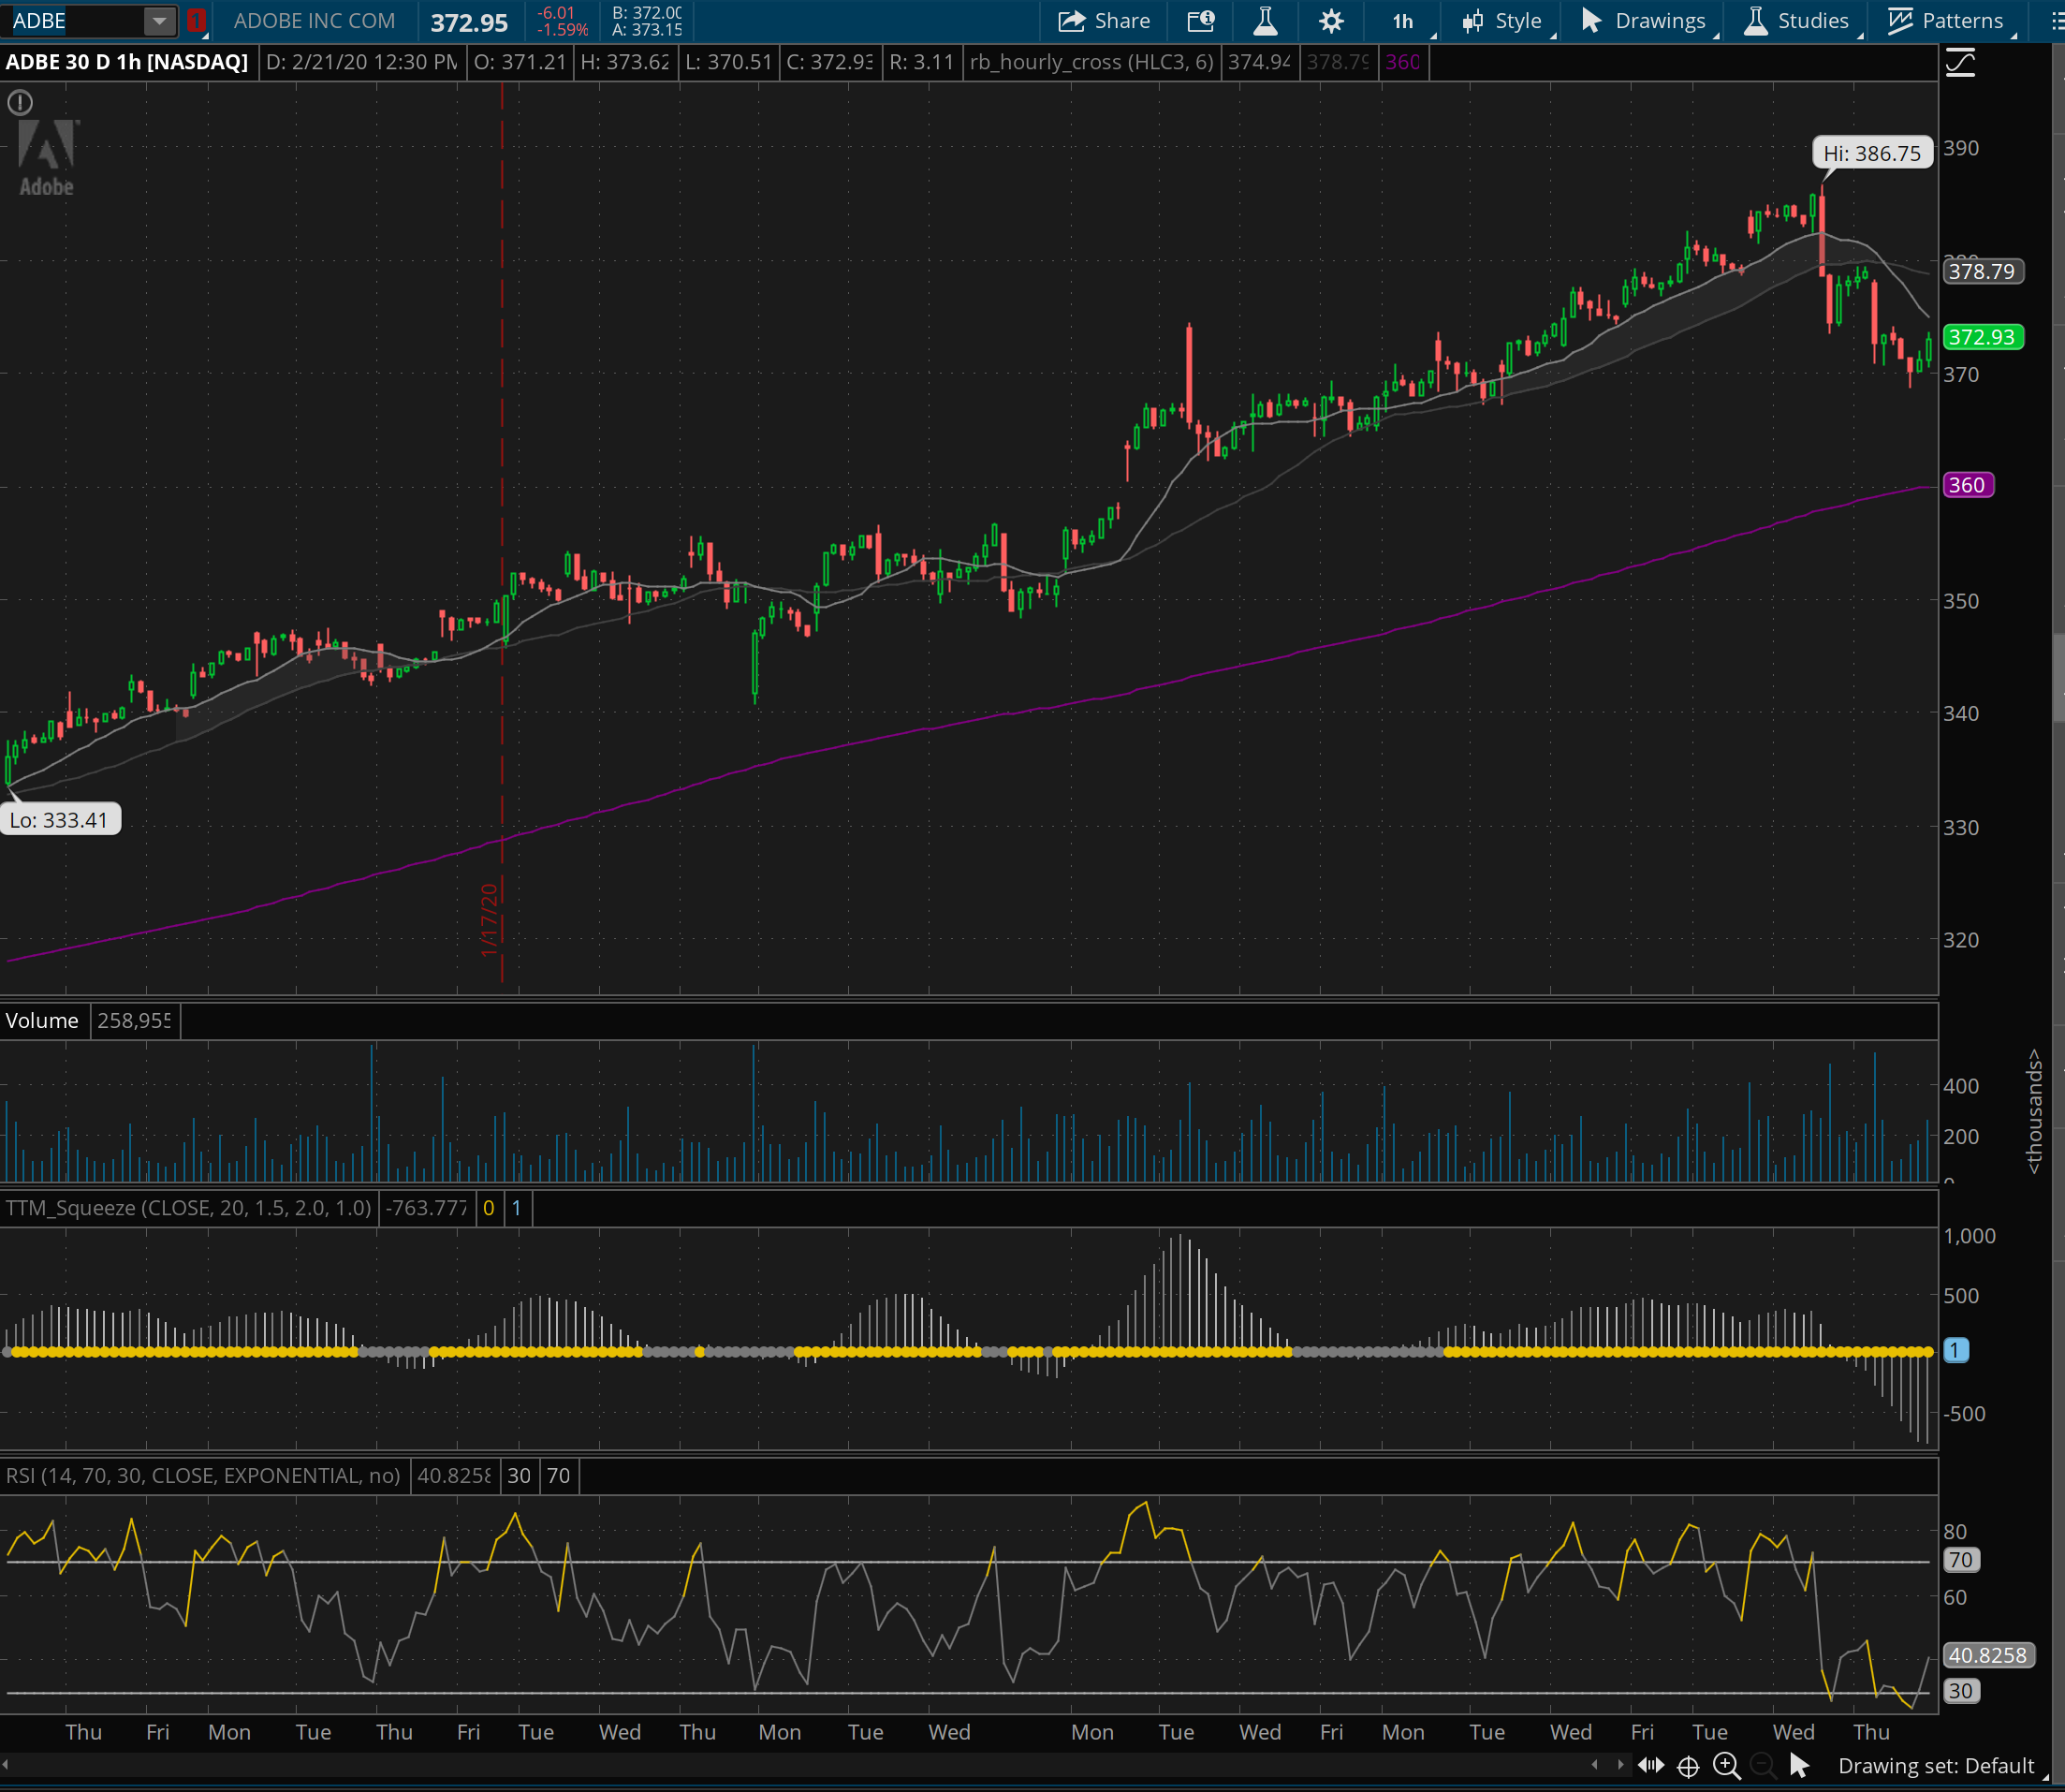
ADBE – Short March 365/360 Put Spread

I’ll look to try and roll this out also if the market starts to come back up soon. I was able to sell a call spread this week similar to what I did with Apple to soften the blow on this one. I got about 1/3 the width of the strikes on the initial sale and have increased my total credit to 1/2 of the strikes so far. I’ll keep whittling down the cost basis to hopefully get this one down to a minimal loss if the market doesn’t rally over the next couple of weeks.

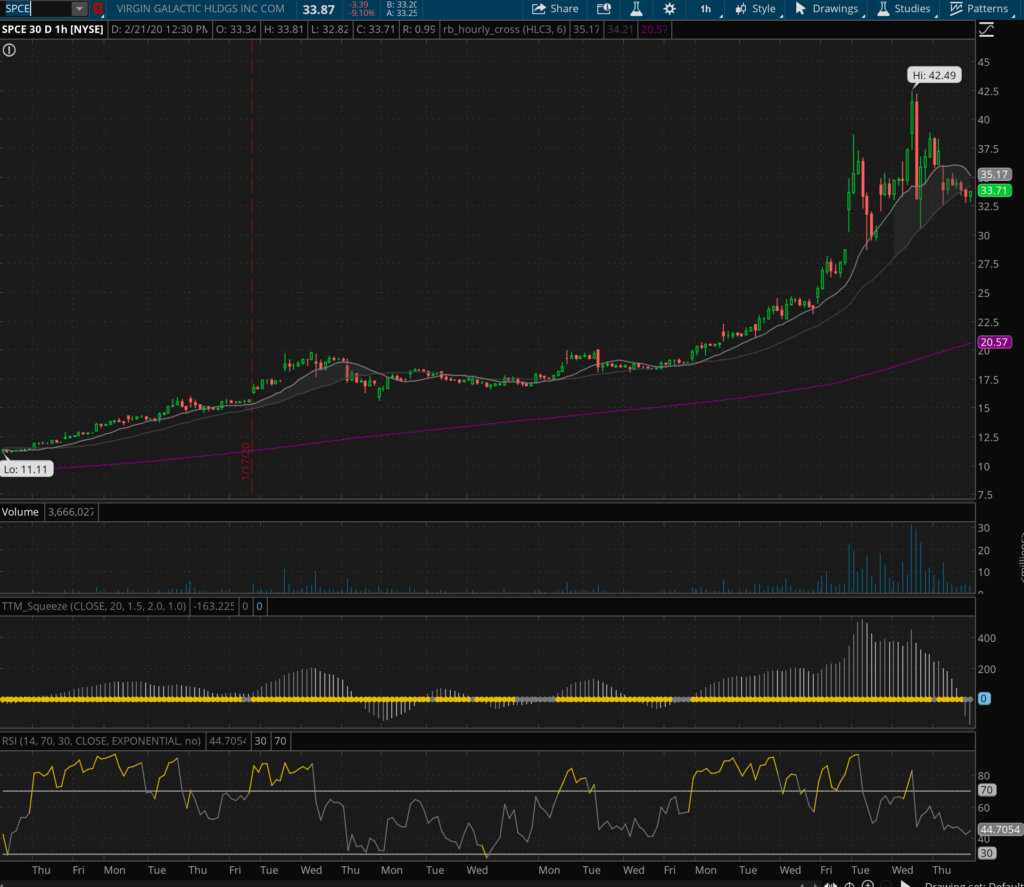
AMBA – Long Calls; Various

Ambarella has earnings coming up and I’m hoping for a nice solid gain here. This is a lotto ticket type of play. Right now it’s looking good.

AMZN – Short April 1930/1920 Put Spread

AMZN Chart

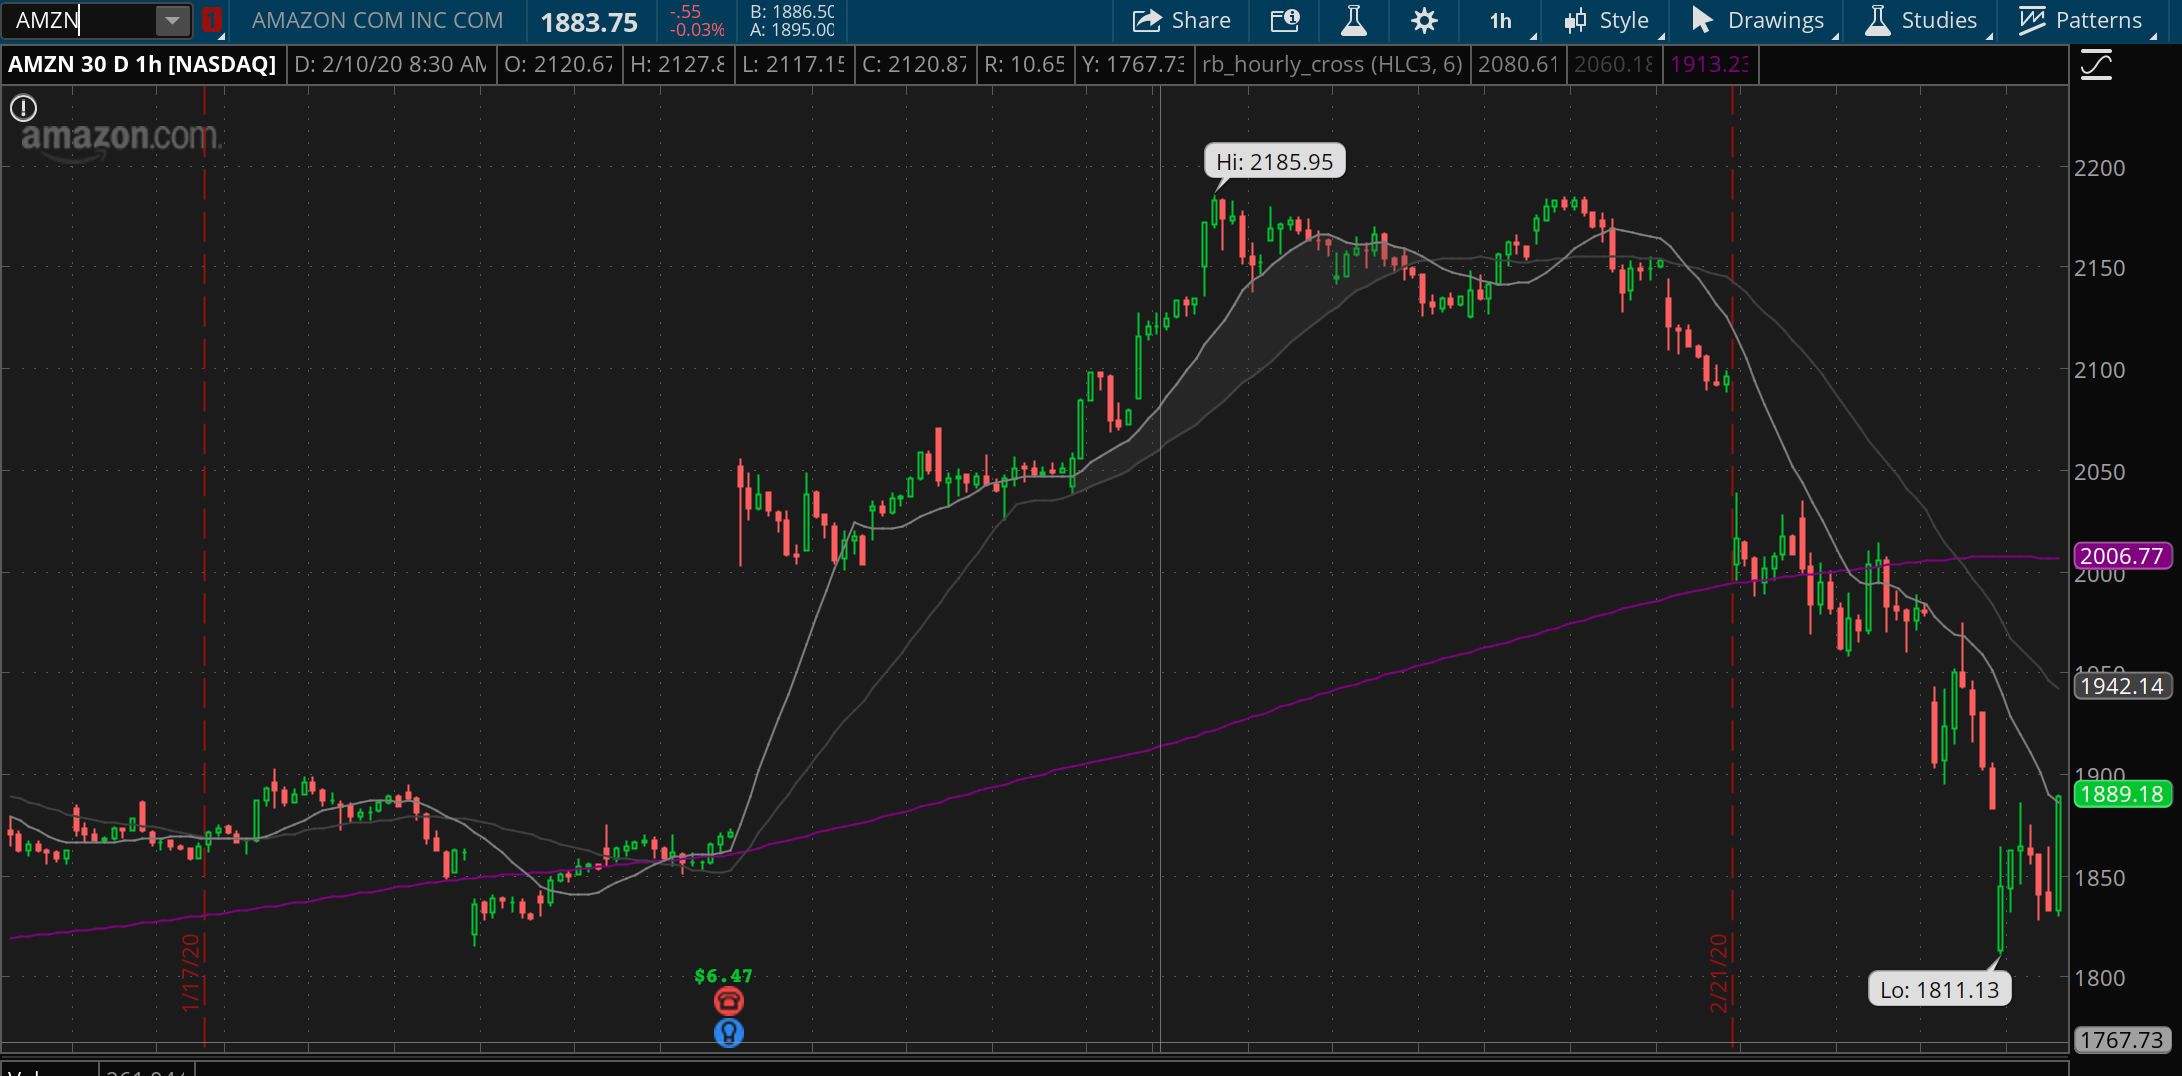
So Amazon just blew the doors off of their earnings and shot up like a rocket ship – then this week started πŸ™‚

This spread started off as the March position from last week, I rolled it out and wider into April. I’m expecting that Amazon will benefit from any COVID-19 risks that are out there as more people will just want to order online and get stuff delivered. I’m basically in this position for about a $5 credit at this point, so I’ll work to spread off the risk once I see market action in Amazon next week.

I’d love to put some calls on above this, but will need some strong upside movement to make that a reality.

CCL – Short March 29/27.5 Put Spread

It’s a cruise line. The stock has been murdered – so much so that it started to recover on Thursday this week πŸ™‚ I’ll keep doing these until I can’t.

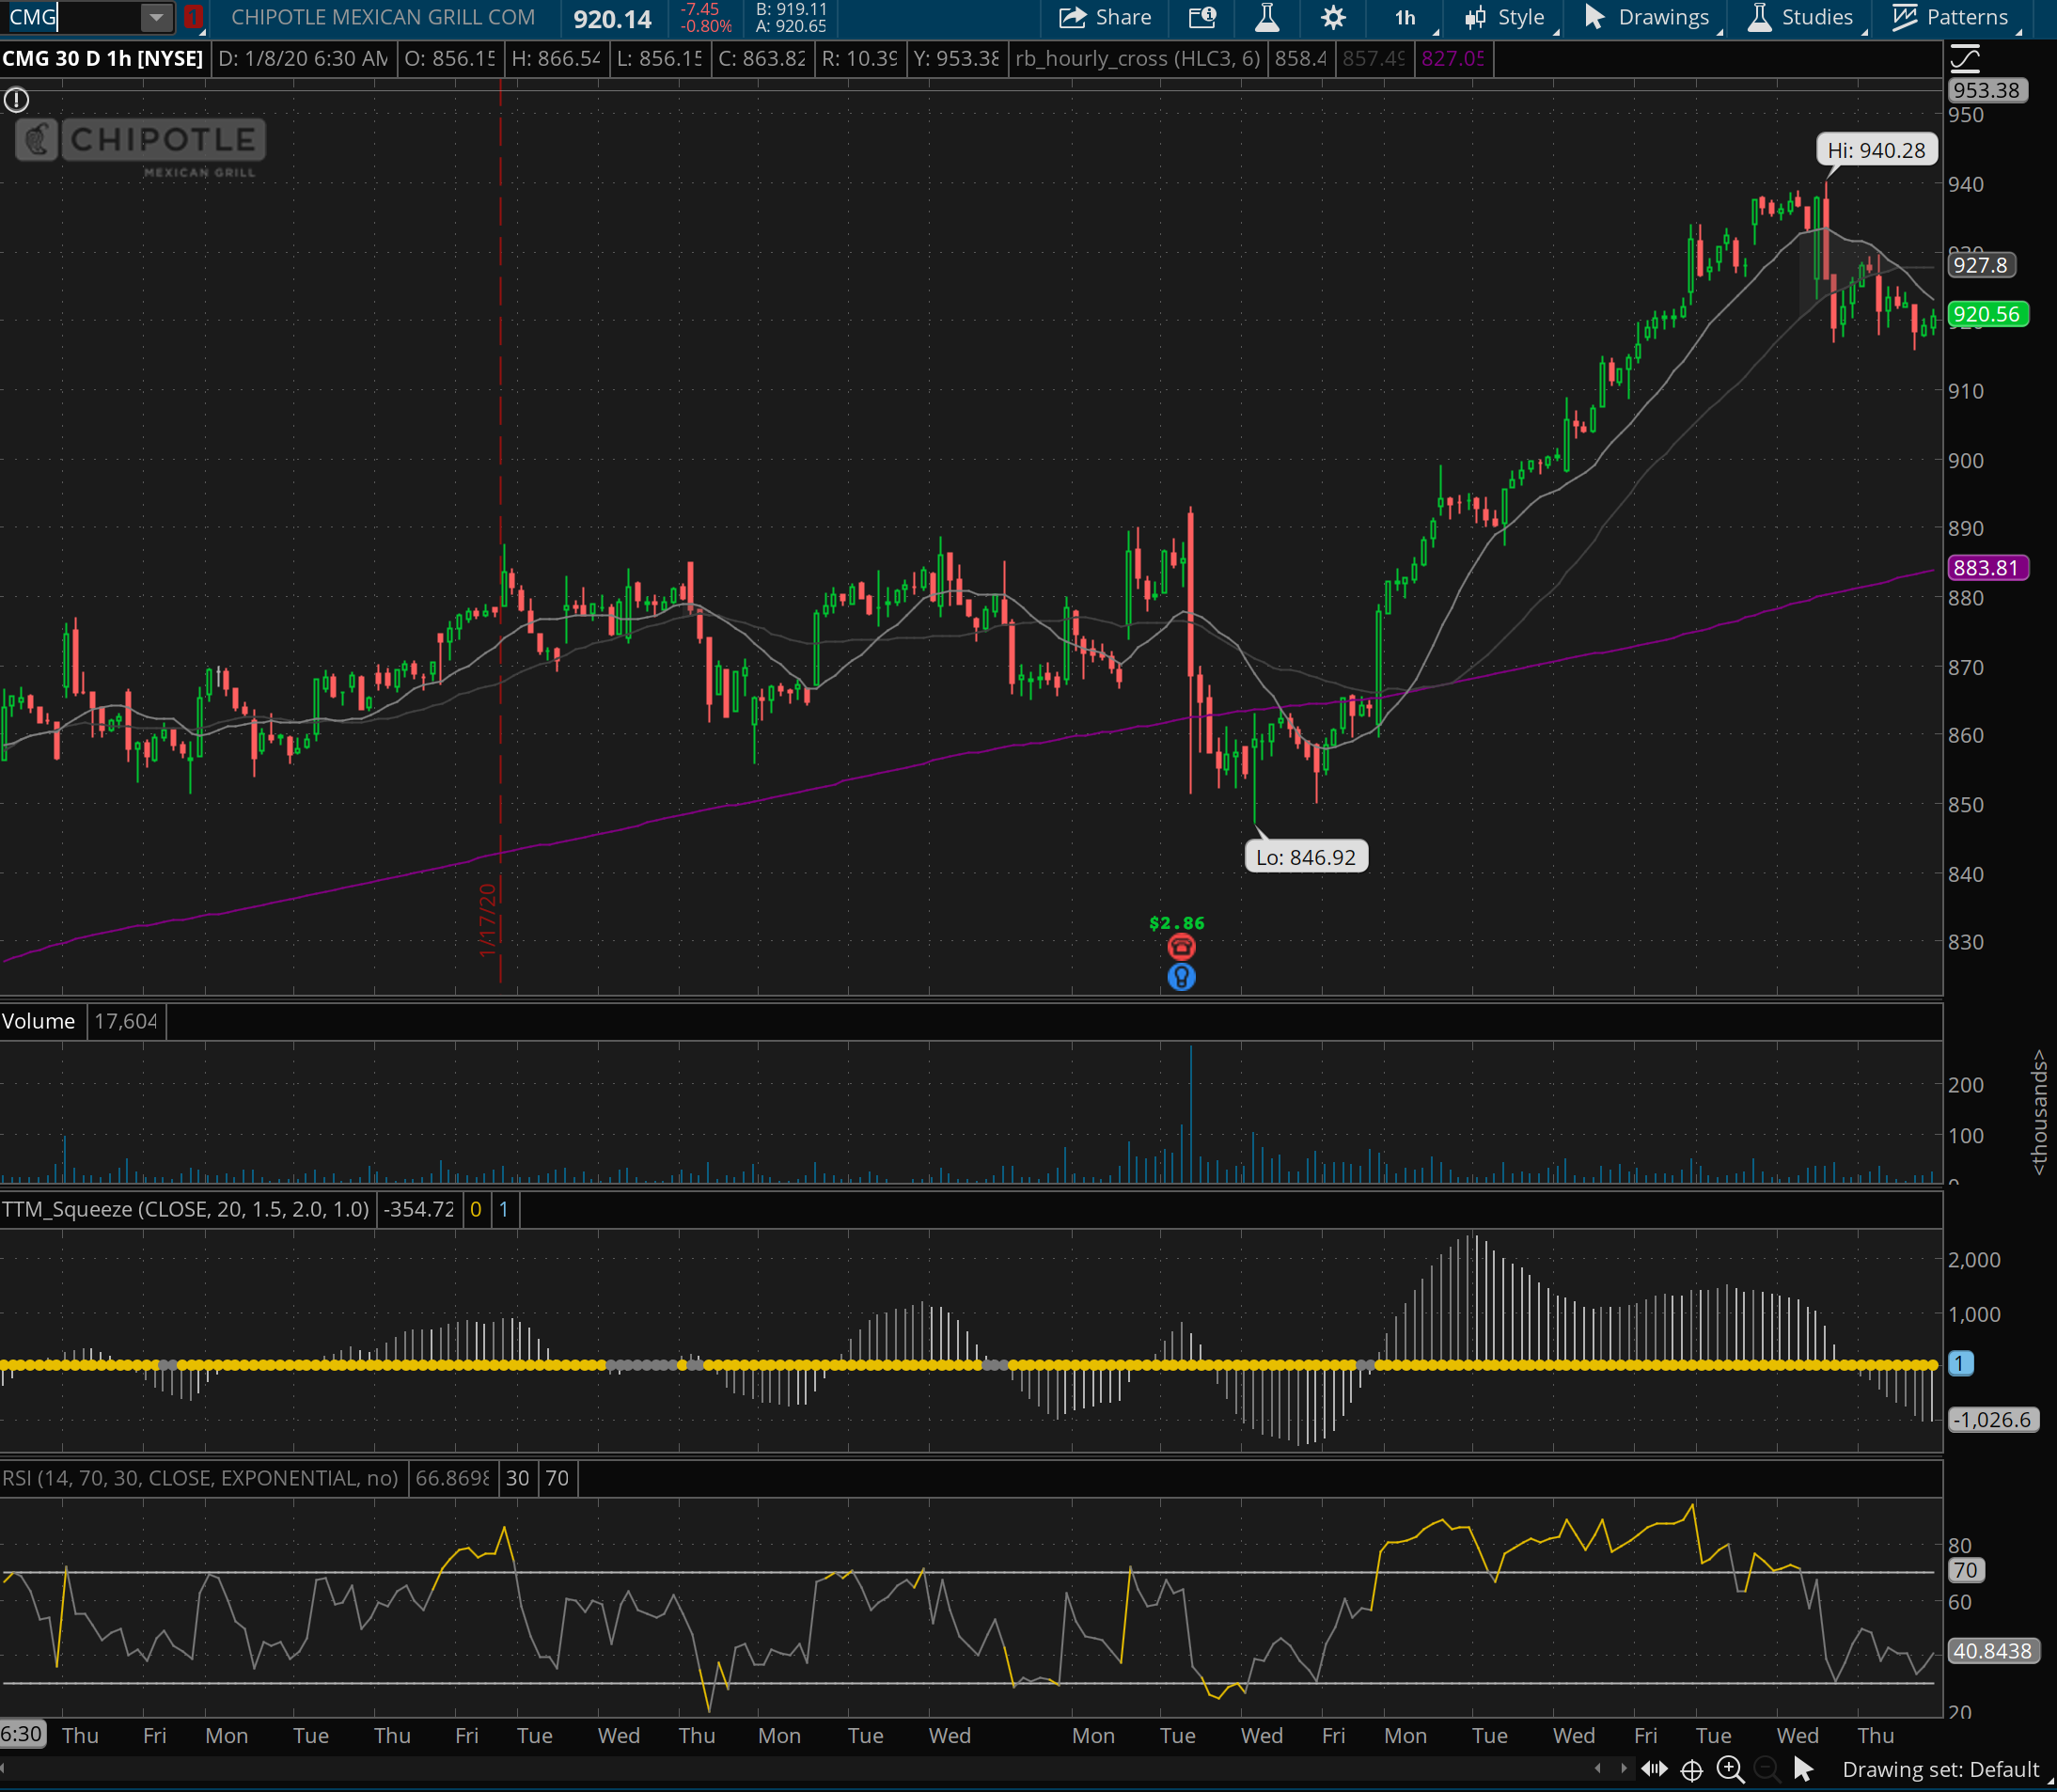
CMG – Short March 950/960 Call Spread

This one is kinda of frustrating to me. CMG has fallen to 773 with the sell off. This spread is so far out of the money at this point that I can’t even buy it back! I’ve tried a bunch of different strategies to pull it in to free up some capital but nothing seems to be working. It’s not a huge position, but it’s holding some cash that I’d prefer to release.

I’ll likely go ahead and sell some put spreads underneath it this coming week given that it appears for now that CMG has found some footing.

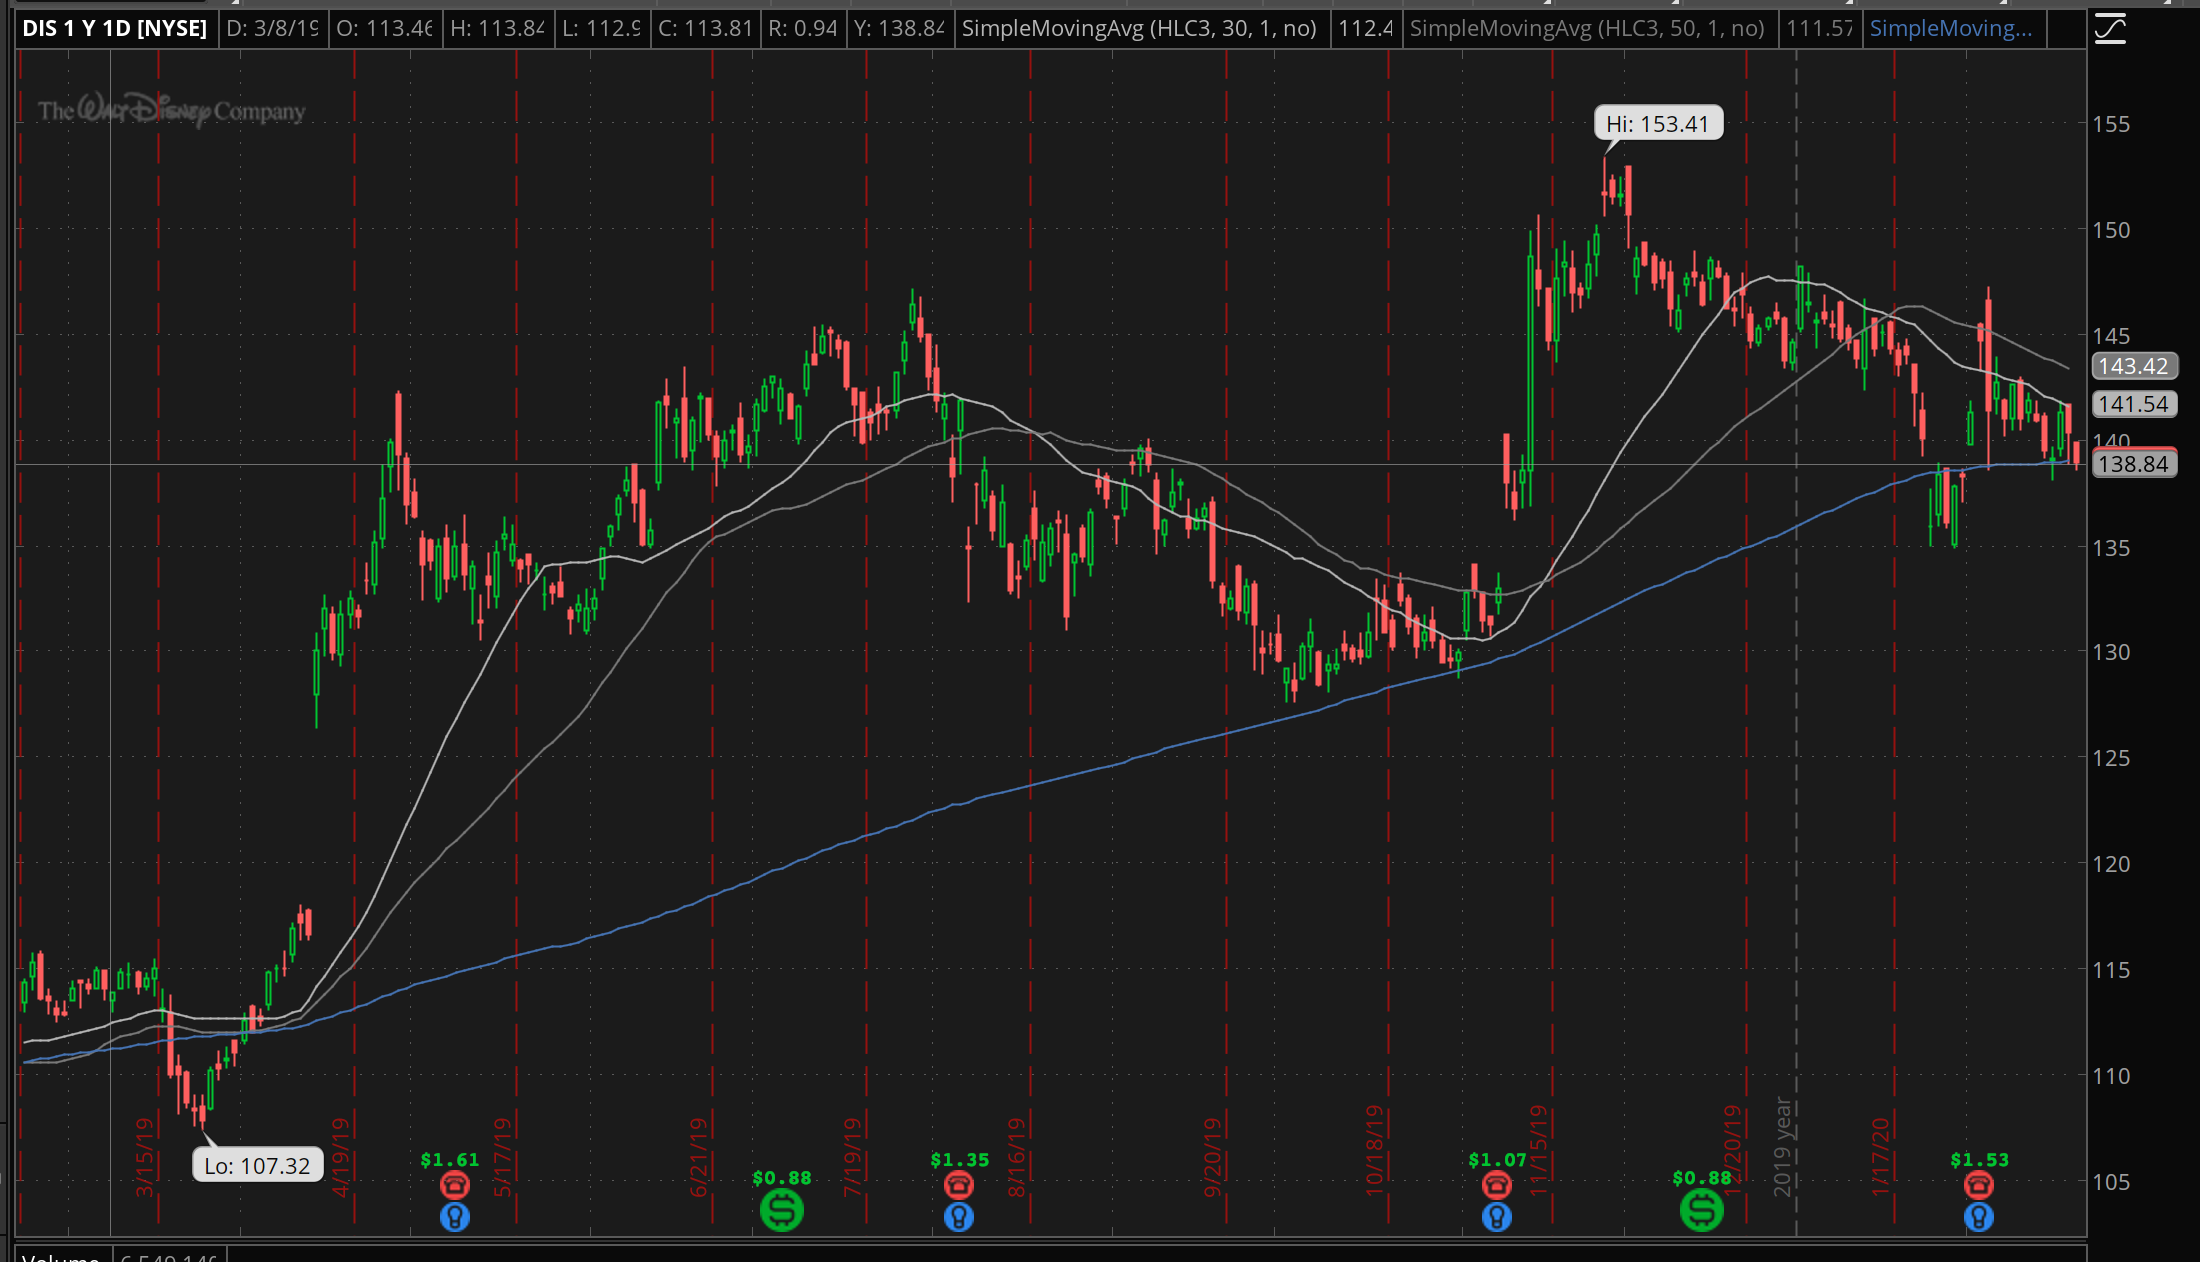
DIS – Short March 6 131/133 Call Spread, March 135/130 Put Spread

This one took a double whammy. With the market drop and abrupt change in leadership, this guy is in trouble. I’m breached and I don’t know if there is any real chance to get this back into manageable ranges.

I’ll keep selling the shorter duration call spreads to try and capture some gains and may end up rolling this out or just closing it down. Disney still seems like a great longer term option, however near term with the parks and everything else, it’s not looking good.

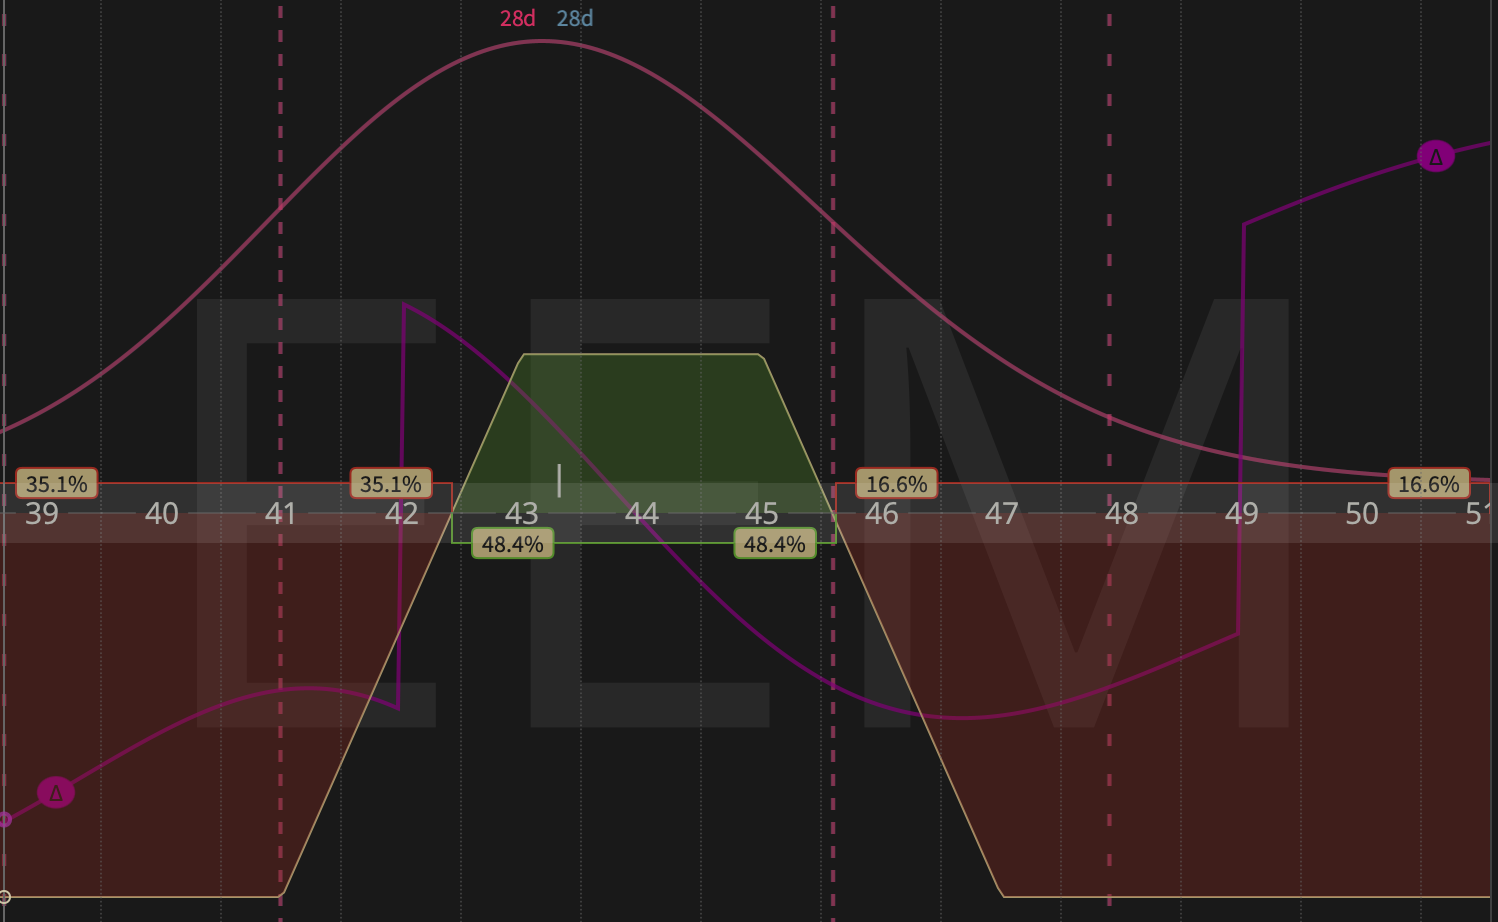
EEM – Short April 40/45 39/33 Iron Condor and 43/41 Put Spread

The Iron Condor on EEM is a new position. Just a normal premium selling type of move. The Put Spread was rolled out for a nickel debit into April. Given the massive moves in the market, I figured it was worth paying a small price to get some more time at approx 21 DTE on this guy. Next week may have been better to move it out, but it felt good to manage positions Friday given the capitulation losses I took πŸ™‚

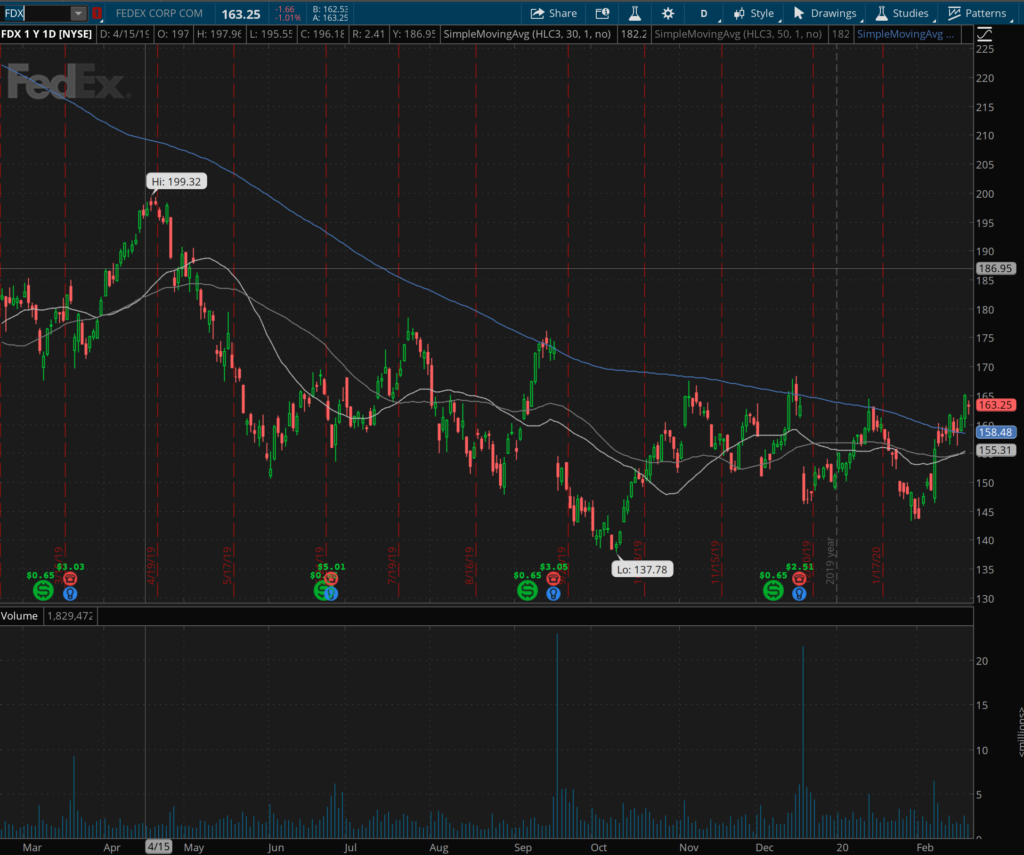
FDX – Short March 160/165 Call Spread

Woot! This one has come back in and it now profitable. The sell-off this week pulled FedEx right back into its range. I’m going to hold onto this one for a while and watch it decay in value before making a decision on profit target. Right now, I’ve got an order in to buy it back for $0.20 if it gets that cheap.

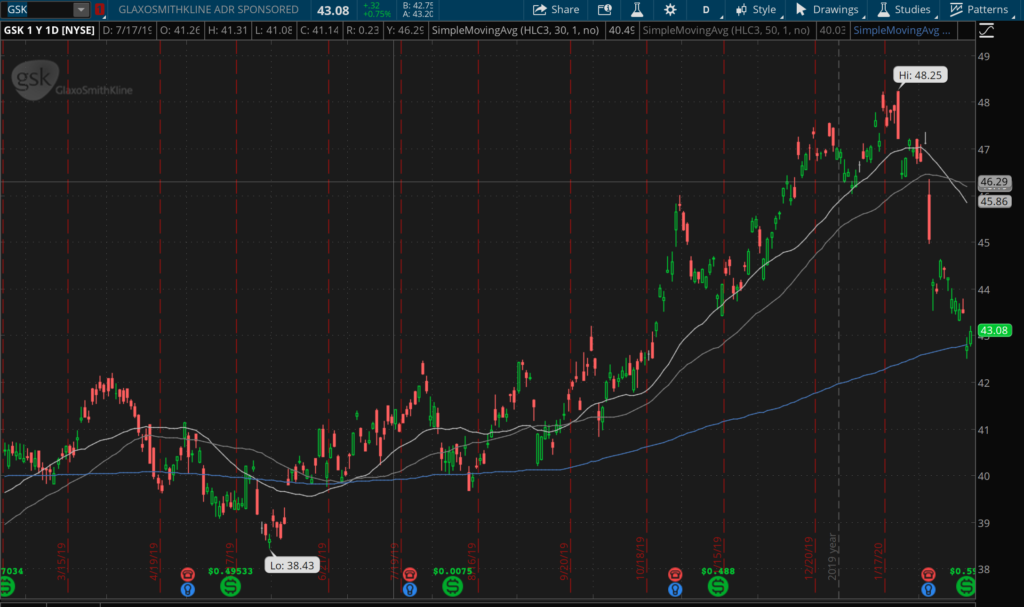
GSK – Long March 44 Calls

These are likely not going to play out. I’m down about 67% right now on the purchase price. If GSK can rally back next week, then I’ll hold them; otherwise it’ll be time to dump these. They are really going to start getting theta decay quickly now.

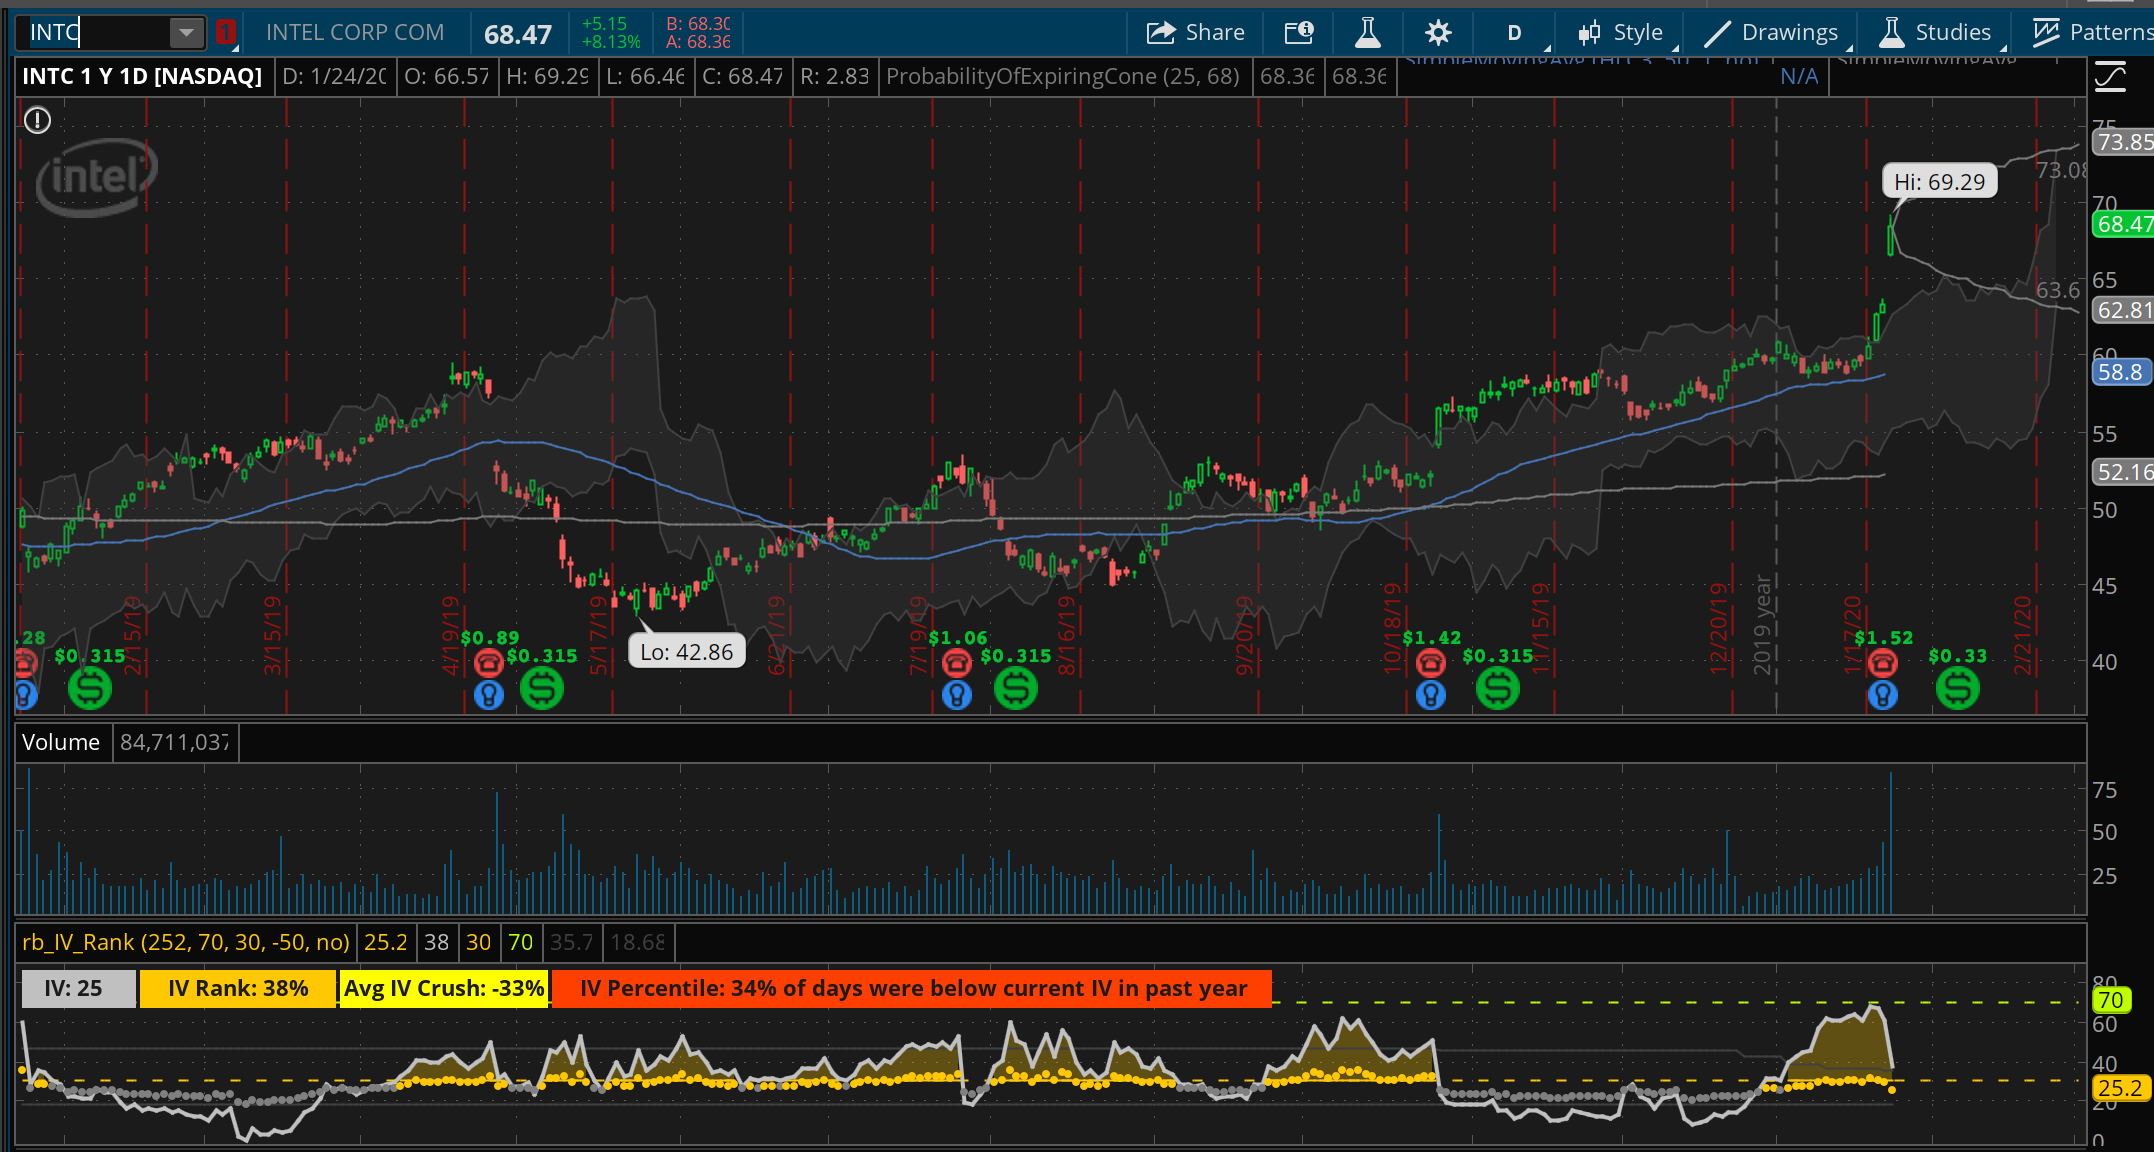
INTC – Short March 62.5/60 Put Spread

Another breached spread that I wasn’t able to roll out of. This one is sitting very close to max loss right now so I’ll be using the same strategies to offset the position with Calls where possible.

IWM – Short April 125/120 Put Spread

This is is a 16 delta Put Spread. I only got $0.62 for it however I wanted to start nibbling on new positions that are offensive vs. just defense.

I’ll freely admit that doing a 30 delta is just a little too close for me given the recent tape action and my near term bias. On a sharp rally or two, I’ll likely during this into an Iron Condor with 16 delta calls. If the 16 deltas get to around 170 or so I’ll start selling the other side.

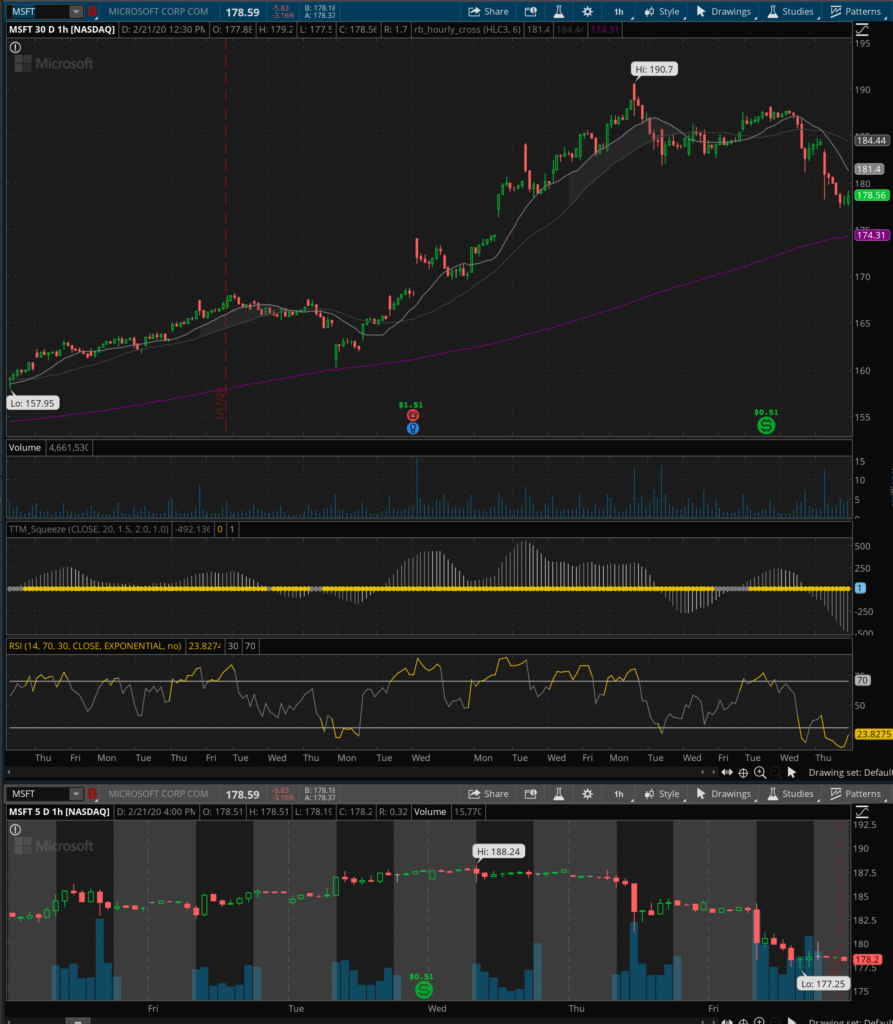
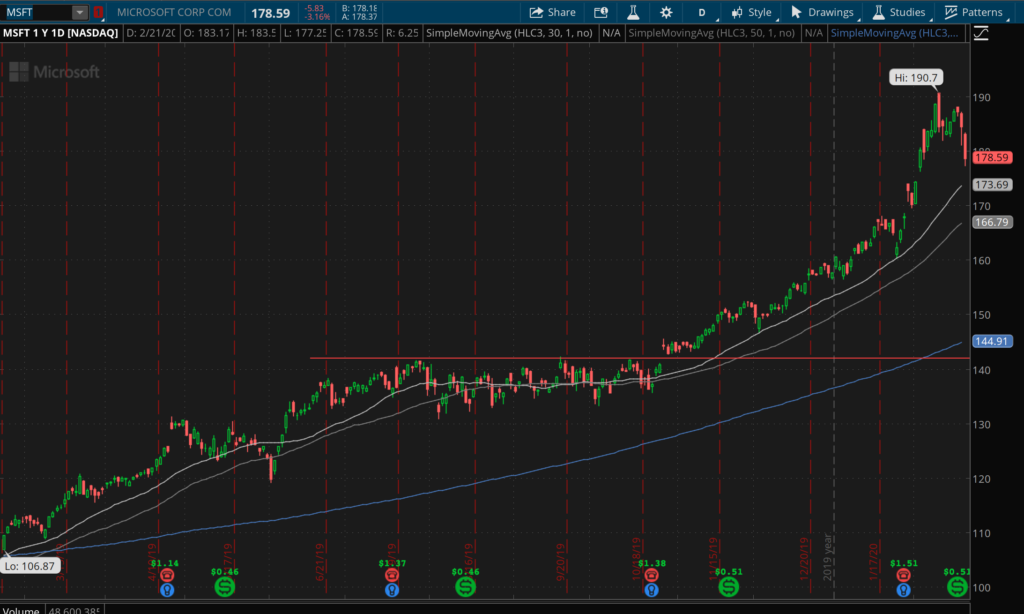
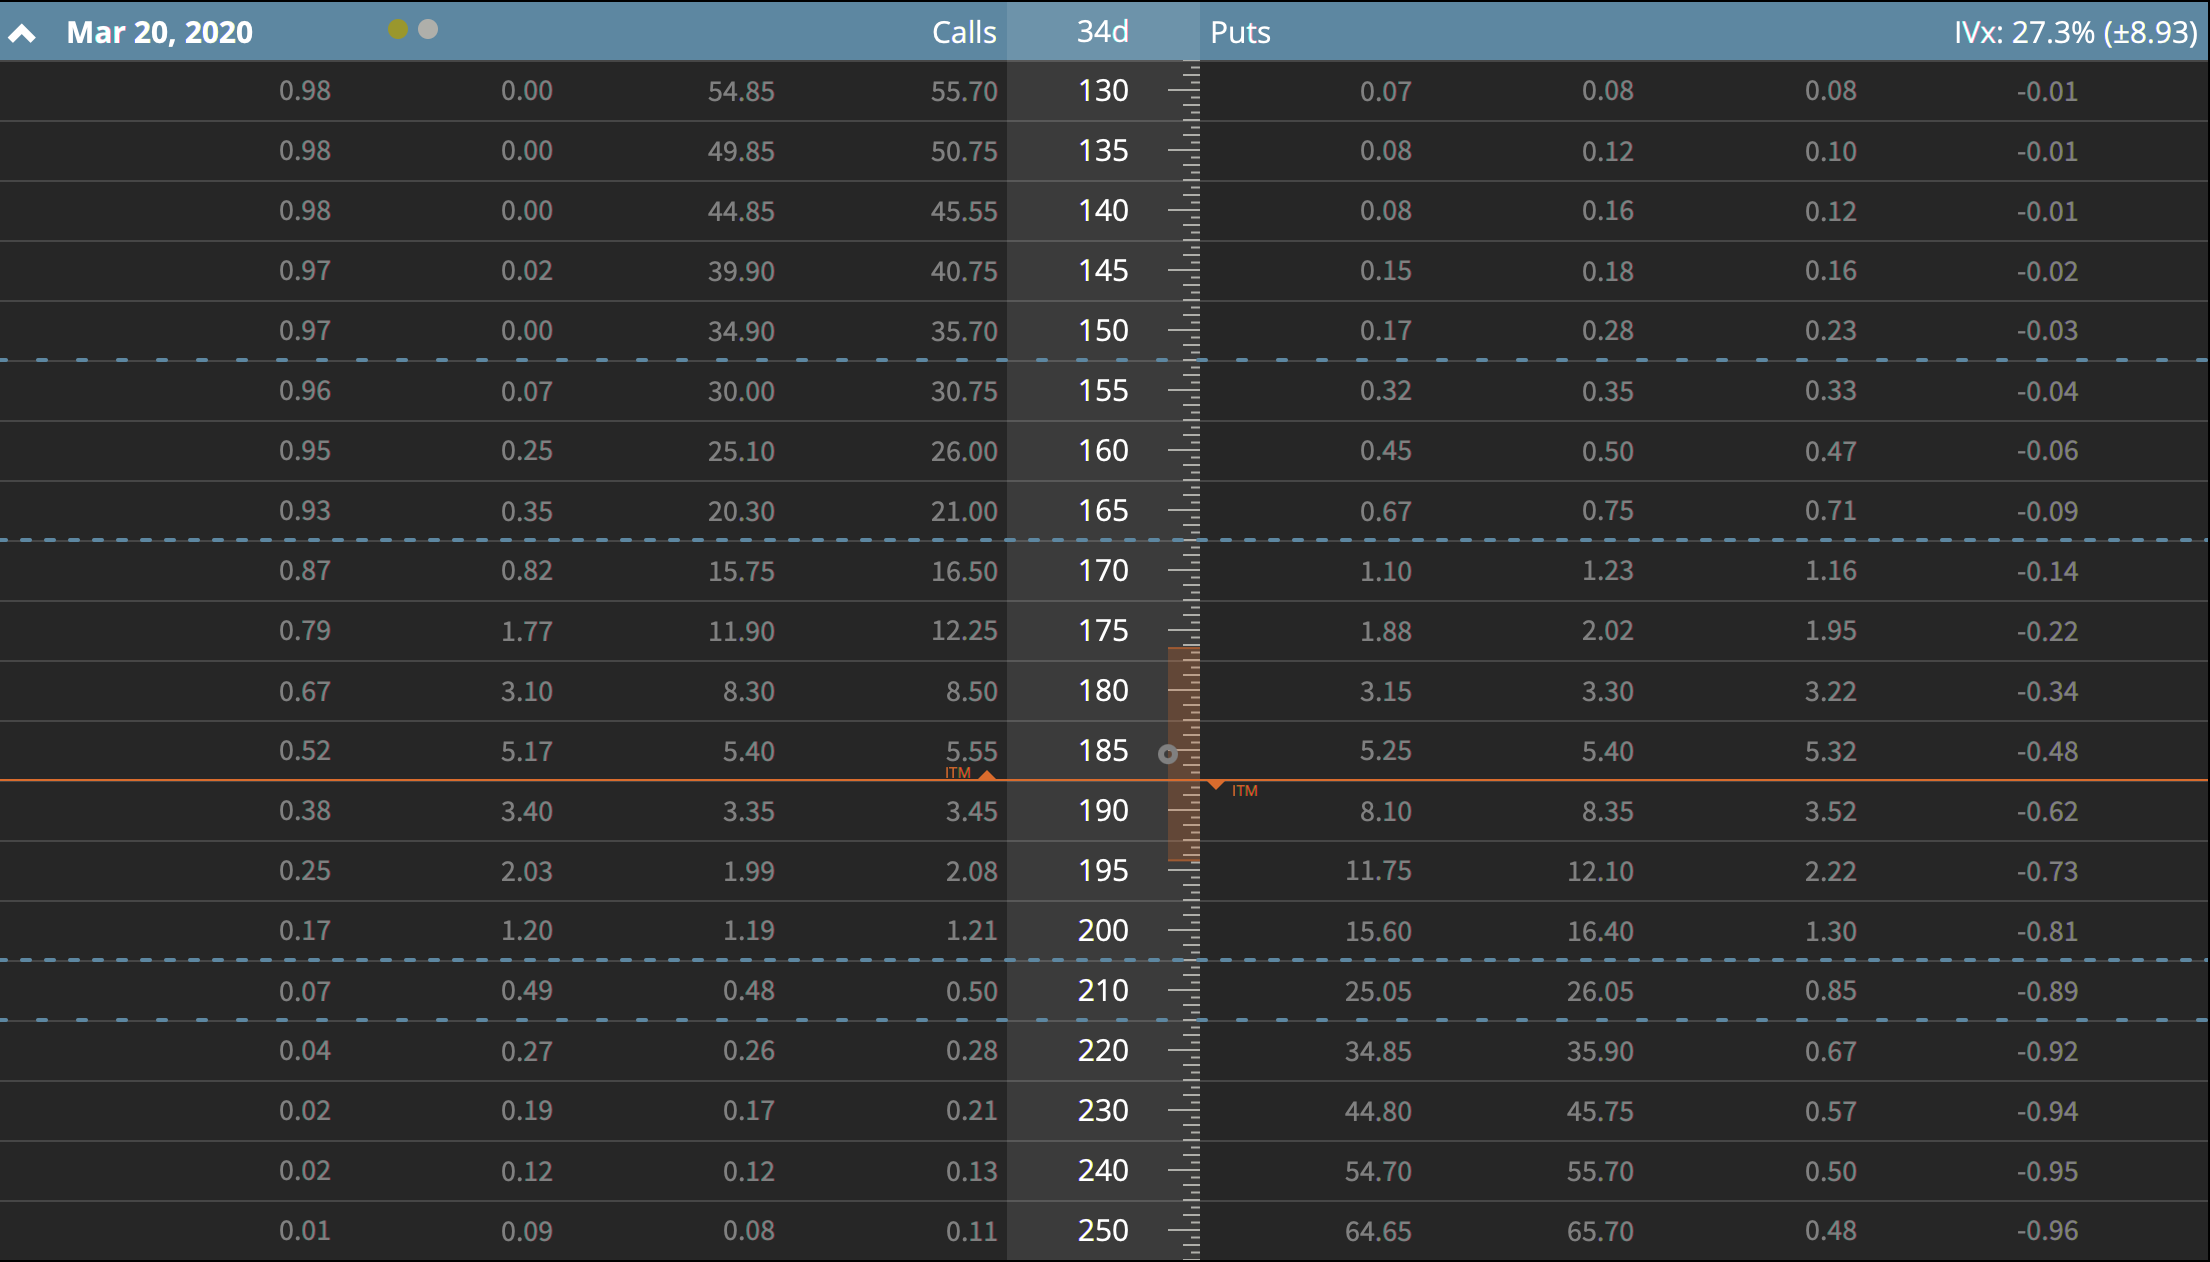
MSFT – Short March 180/175 Put Spread

Microsoft had a strong up move today so maybe it’s possible this guy comes back – however that’s unlikely. I’ll be selling calls against this position for the next few weeks if the tape looks promising.

SPX – Nothing, everything expired 100% profitable

This was my best trade for the week! Another 3 for 3 stellar SPX selling test. I laughed on Friday morning when I sold 2725/2720 put spreads for a decent credit with 0 days till expiration. I’ll freely admit that I was worried about selling anything and went insanely low, but good grief – that would have been a 250 point down day in the S&P 500.

I’ll take the profits and smile. This is still a really small trade, but it’s proving nicely reliable and profitable. I’ll keep scaling it up throughout the year where it will hopefully begin to become meaningful in size.

I’m taking the scale yourself approach with it given how risky this stand in front of a train type of trade can be. Meaning that I am only scaling this with the profits it creates.

SPY – Short March 314/312 Put Spread and April 245/240 Put Spread

Welp. I bought back all of my puts on Monday and decided that we had a nice little drop on our hands that could be quickly profited from. So I sold some puts underneath it (why not calls above it, why not calls!!!!!) – ouch.

The March position is totally busted and I’m not sure it’ll come back. I’ll look to roll it if it make sense, or just keep selling things around it. I’m hesitant to sell calls right now until the market gets a bit of a relief rally. Although Tuesday, Wednesday, Thursday and Friday would have all been good times to do that.

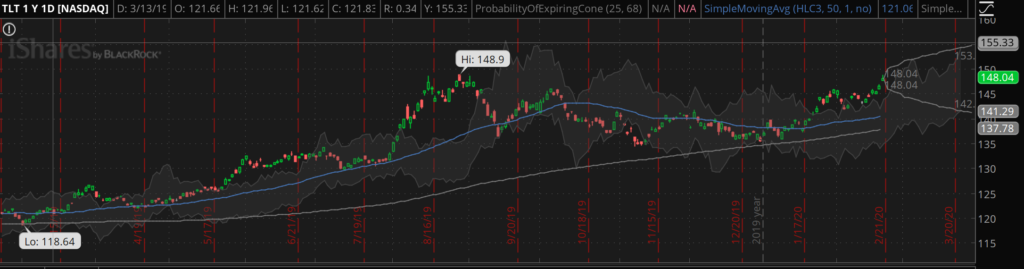
TLT – March Iron Condor (Calls Rolled to April) 148/151 142/139

I rolled the calls in this one to April to avoid assignment of the fairly deep in the money calls. It wasn’t cheap, but it was better than taking an almost full loser this early in the game.

Bonds are up, and headed higher. I don’t really think this is going to come back in so I’ll be selling different positions through the month. Worst case, I’ll have cost myself an extra $0.20 for some peace of mind and avoided dividend risk (which was more than $0.20).

UAL – March 60/55 Put Spread

I sold this guy on Thursday. It looked a lot better on Thursday. This may be a problematic spread over the next couple of weeks, so I’ll need to figure it out as the market plays out.

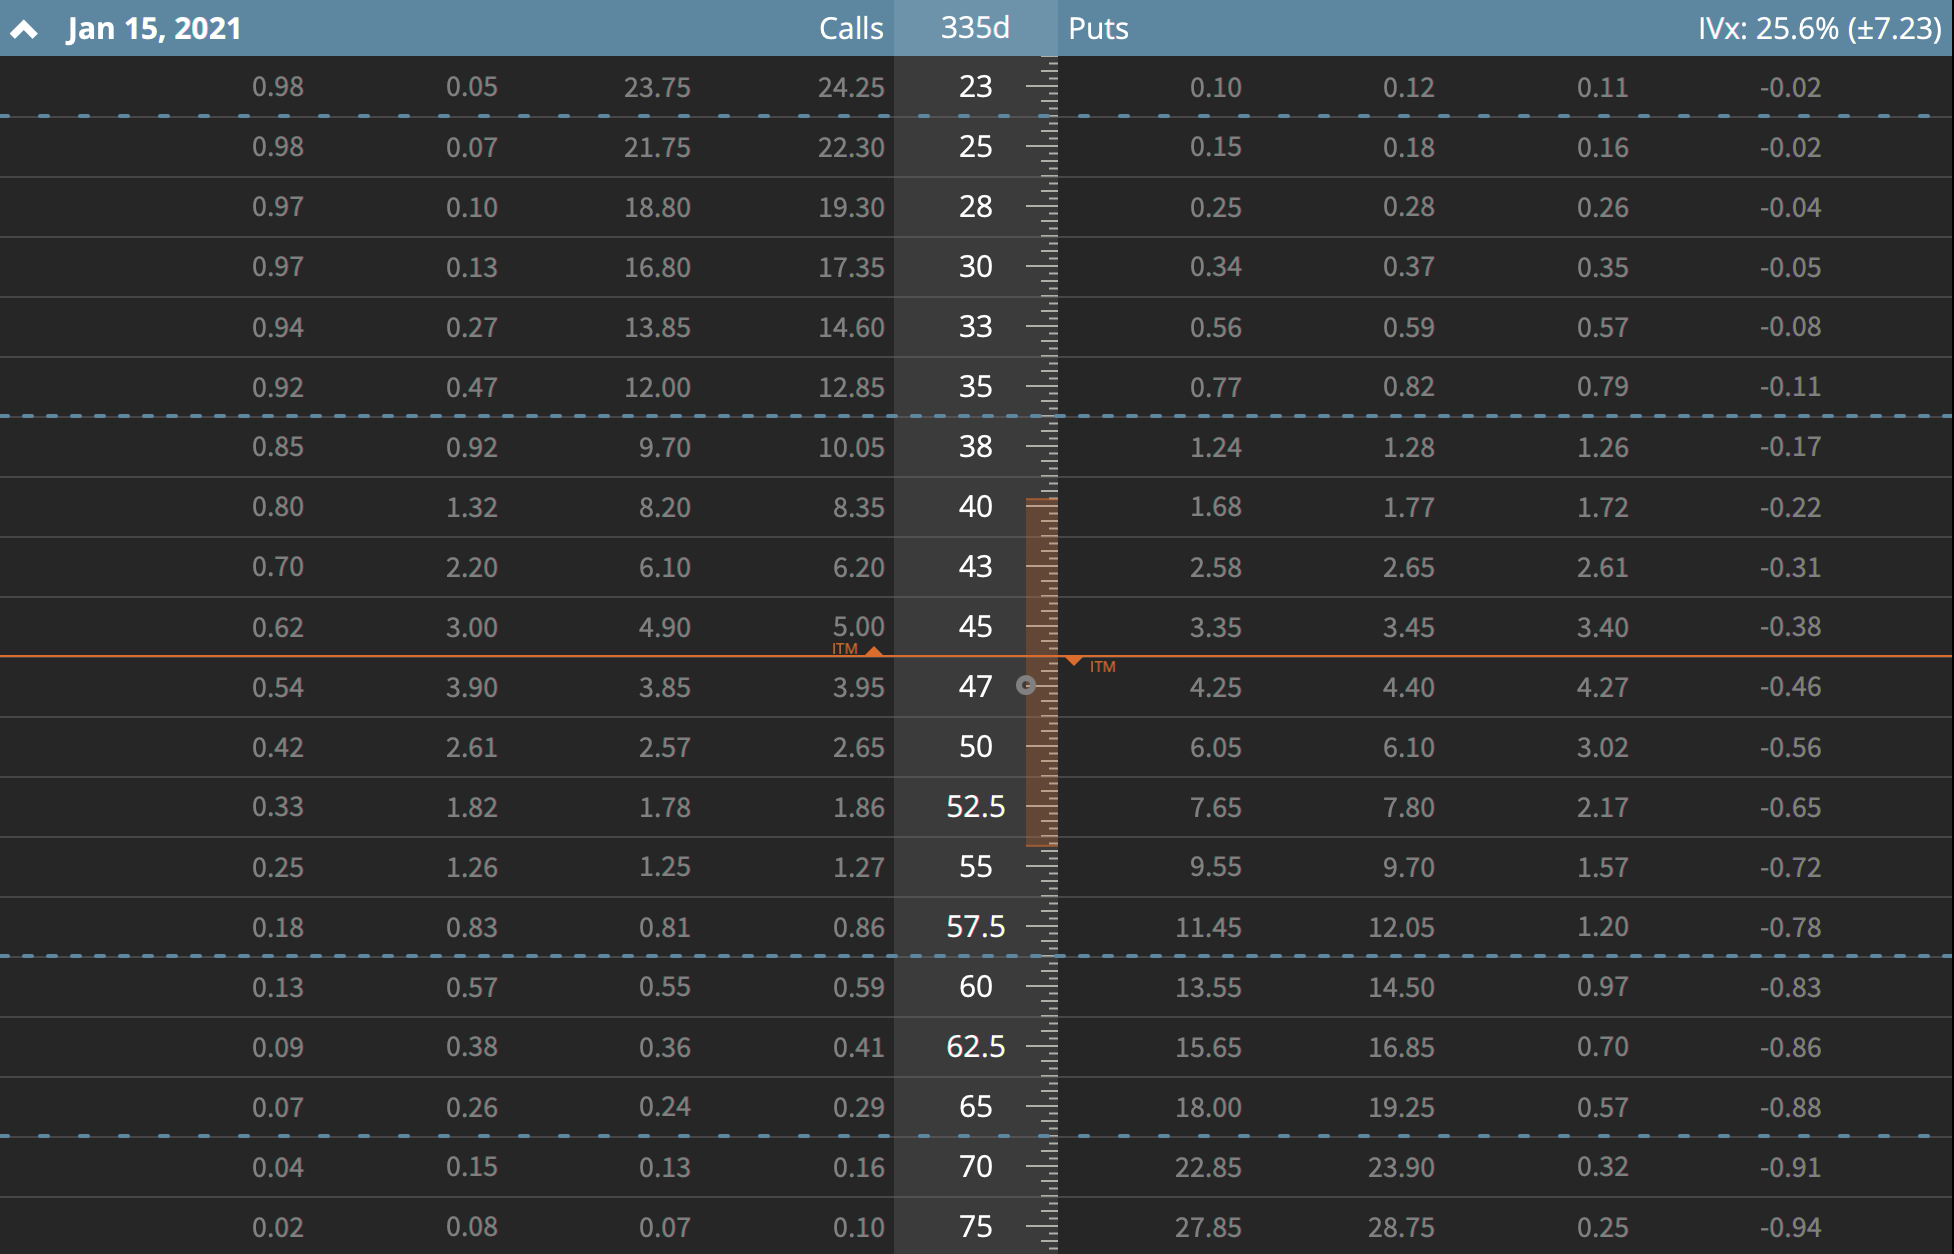
UVXY – Short March 13 15/19 Call Spread and April 17 26/29 Call Spread

Well, this kind of turned into a mess. I started shorting vol early in the week with a 15/17 call spread. That was way too early, so I spread it off again at 17/19 mid-week resulting in the current 15/19. On Friday I put in the 26/29 which is likely the best position πŸ™‚

My 15/19 is going to look really odd as I mange it through the next couple of weeks. Because the original 17’s were basically sold back for a sizable credit on the 2nd spread, the position is now a short debit spread when I look at my P/L. In reality, there is still plenty of credit that I received for doing both of these, however given that the 17’s are flat, the credit is already realized.

I’ll keep doing these if I can over the next couple of weeks as vol comes in. The March 13th spreads may be in trouble if things don’t settle down reasonably soon. I’m find exiting that for a scratch play if needed.

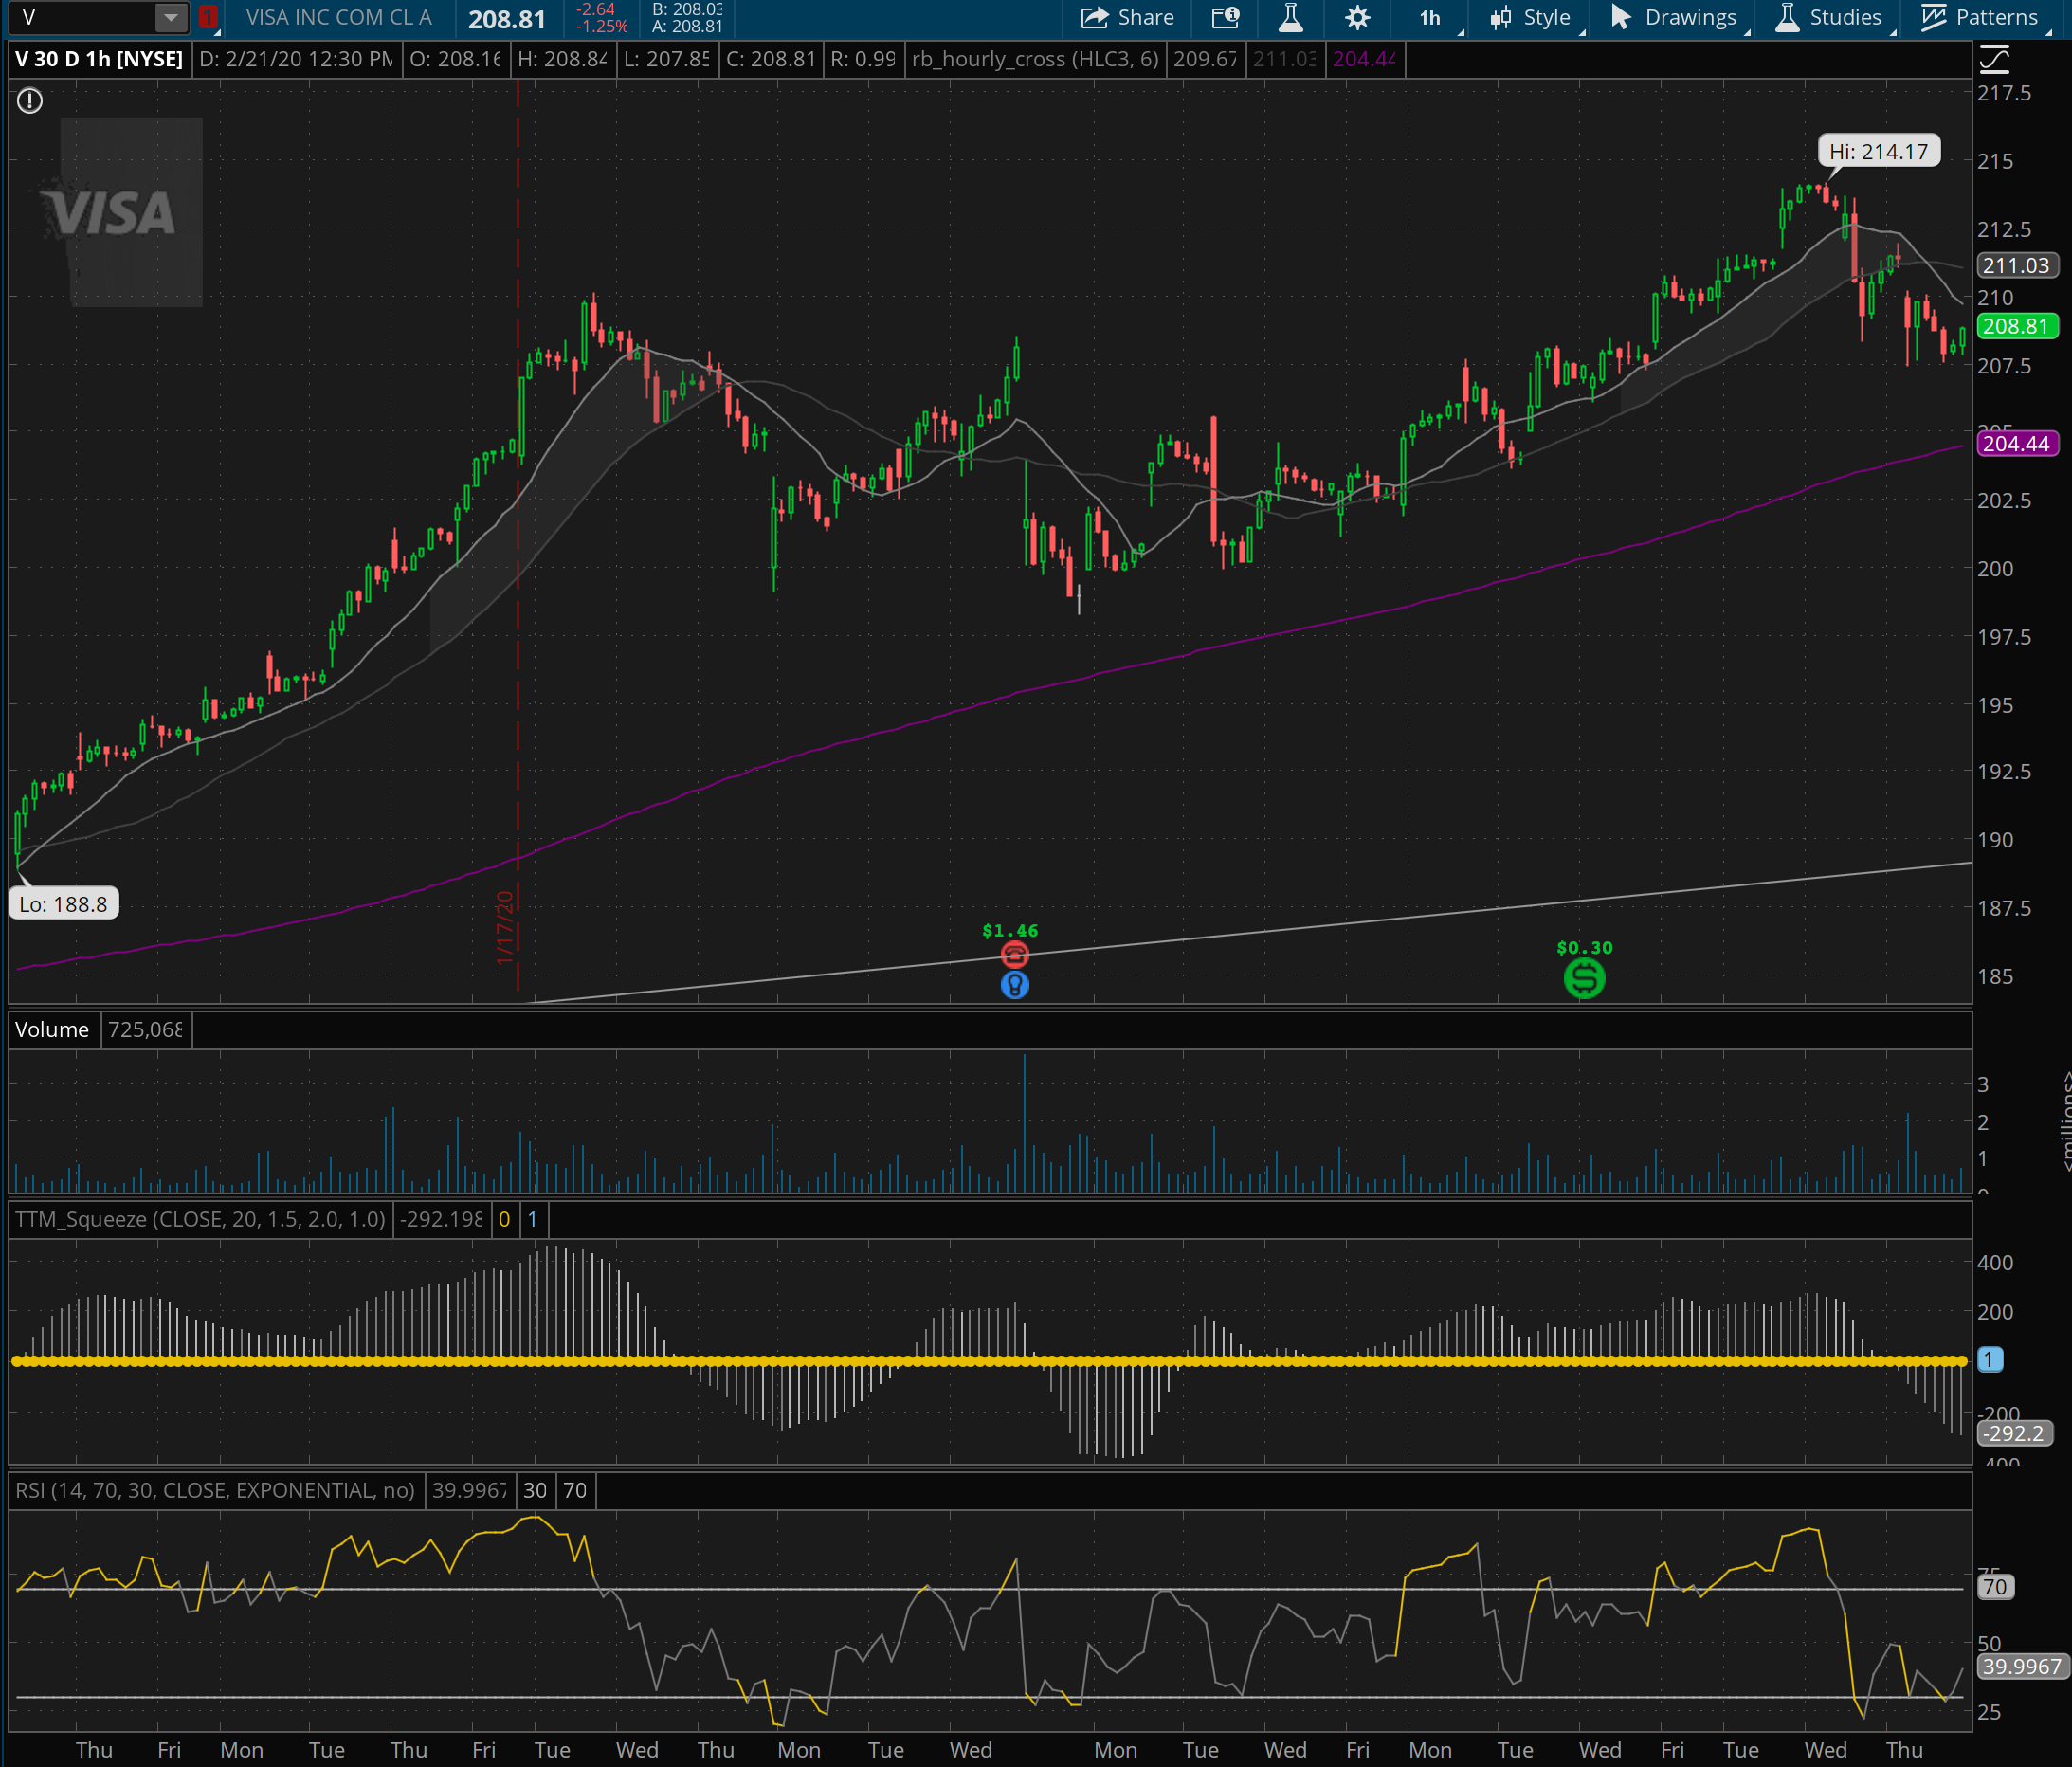
V – Short March 205/200 Put Spread

V had a nice rally today, and hopefully it’ll start to come back a bit. I’ll keep an eye on this and defend as much as I can.

VXX – Short March 17/19 Call Spread

Another early entry. Assuming things settle this should be find. I wish I had done April though πŸ™‚

WYNN – Short 100/97.5 Put Spread

Another new position on a beaten down name. This on is not breached yet and is basically the current 30 delta Put Spread. I’m honestly don’t remember why I decided to make it so tight on the strikes.

YETI – Short March 6th 30/29 Put Spread

Yeti came back above my short strike today which is great. I’d really like to see Yeti hold this into next week so I can get out of this guy for a nice profit.

It’s a correction! Feb 2020

And just like that, the gains from November 2019 to last Friday are gone.

This week has been a pretty interesting one in the markets. I’m a bit surprised at the price action, it’s been far more aggressive to the downside than I expected.

My plan of attack for this price action was to capture profits after the first major drop, load up for a quick push higher, then repeat on the next leg down.

This week didn’t work very well for that type of a plan! I was able to capture some very nice profits on Monday, and reloaded for a quick push higher – so far those positions are sitting on some nice paper losses.

I’ve continued to nibble throughout the week on the longer side of the trade as the market has just flat dropped; those trades haven’t been profitable throughout the week and the great gains from Monday have been mostly eaten up on paper at this point.

That’s a fairly frustrating situation – welcome to trading!

I’m still expecting a firm recovery; however I don’t think the intermediate play is to the upside. Daily movement yes, maybe even weekly to play for a quick pop to the higher side.

I’ve been selling vol all week in VXX and UVXY; I expect those will end up very nicely profitable – for right now they are just ugly ducklings.

At the close on Wednesday, I went long /ES at 3110, needless to say that was a painful thing to see in the morning on Thursday, however I expect this to continue to move in the right direction today or tomorrow.

Anyhow – stay safe and trade within your risk boundaries!

Here’s to a brief relief rally today or tomorrow πŸ™‚

Trade Log – Week Ending Feb 22 2020

What a roller coaster of a week!

I started out with some spectacular gains in SPCE and a few other trades. After reflecting over the weekend, my posture changed to play the price action more aggressively this week and as a result moved to a very net long delta position across the board.

This included spreads in ROKU, CRWD, BA, MSFT, AAPL, SPY and others all with net long delta. Well, it turns out that again my market timing was pretty horrific as the market finally began to realize that the COVID-19 virus is real, and that economic activity is likely going to be curtailed a bit.

You’ll read everywhere that calling a top is hard – well, it is πŸ™‚

I have a bunch of trades open for the weekend; a few of them don’t look that great. We’ll see how next week goes – I’m heavily hedged with short /ES again and a bunch of SPY and VIX short deltas. I think we are very near a top at this point, and if it isn’t this coming week, I think at a minimum it’s this year!

Current portfolio positioning is short delta and a bit shorter theta that I would prefer with all of my long puts πŸ™‚

Here are the positions:

AAPL – Iron Condor in March 345/350 310/305

AAPL Hourly Chart

Apple looks like it’s forming a decent range around the 305/330 area. I’m starting to be a bit concerned as its recently broken the 200 hour moving average; however it’s longer term 50 day moving average sits right around 305.

AAPL Daily Chart

Short term, the upward momentum for Apple has clearly faded away; it appears to either be forming an intermediate base or preparing to roll over. I’ll need to keep an eyeball on this guy. If it rolls over and breaches the upward trend, there is a LONG way to go before it find prior support.

The supply chain interruptions in China as well as potential reduced sales fo the iPhone due to COVID-19 could be a real problem for future earnings. It’s very possible this most recent leader, is the leader down.

ADBE – Put spread in March 365/360

ADBE Hourly Chart

ADBE was looking good until late this week. On Thursday, something occurred that caused a fairly large down move in the near term and it has now breached momentum. This continued into Friday which has me a bit concerned that I’ll need to close this out for a loss next week.

ADBE was in a very nice upward move and this spread started out pretty nicely last week. It’s a small position; and in continued market weakness I’m not sure if ADBE will be able to stay above my strikes.

CMG – Iron Condor in March 950/960 830/820

CMG Hourly Chart

CMG has been on a tear lately! Selling an Iron Condor into this moving train was maybe not my best idea ever; however so far it’s been holding up. I am definately hoping for an extension of the recent pull back CMG has seen – ideally back to the 875-900 range. If CMG can pull into that range, I expect this guy can close down for a nice 50% profit.

COST – Call Spread Feb 325/320

COST Hourly Chart

Costco looks like it’s starting to top out here, so I’m playing this one on a short duration with the expectation of peeling off a 20-30% profit next week. Assuming the market continues to turn around and pull back a bit, Costco should do the same. I will continue however to spend lots of money in the warehouse as is our typical weekend pattern!

DIS – Iron Condor in March 145/150 135/130

DIS Daily Chart

This is a pretty standard trade. I’m going on the expectation that DIS is a little long on the whole Disney+ thing and that with all of that priced in it’s going to consolidate for a while. So far this trade seems to be panning out nicely. I opened it up last week, and have a 50% profit target currently.

EEM – Various Feb and March; Main position is Iron Condor 45/47 43/41

EEM Risk Profile

I’m a bit wrapped around the axle on EEM right now with some straggler calls and puts from positions I’ve closed through the month of Feb. Given the moves EEM has had over the last 30 days or so, I’ve been able to take off a bunch of short options for near full profits.

The current position is getting close to being breached on the low side, but that’s likely okay if the typical pattern of this EEM plays out. It’s got a few weeks to work and I play to let theta decay do its thing.

FDX – Call Spread in March – 160/165

FDX Daily Chart

This one is currently breached as FedEx has run up quite a bit. I closed the put side of this Iron Condor for a nice fat credit during the week. The remaining position will likely be just fine as FedEx seems to like to go up to about 165 and then back to 140. I expect that’ll happen again here and this will close for a nice profit as well. Target is overall 50%.

GSK – Long 44 Calls in March

GSK Daily Chart

The Glaxo Smith Kline chart looks horribly oversold. The selling that occurred on the 5th was heavy volume, and it’s continued to follow through. I’m playing this on a fairly short leash under the simple assumption that it’s been under too much pressure. These where very cheap, and the position is fairly small. I’m looking to get out of these for a nice little profit next week.

INTC – Iron Condor in March 70/72.5 62.5/60

This one is right in the middle of the range or so. A little closer to the bottom that I’d like but that’s okay. Assuming the market does just take a total nose dive, I’ll try to get out of this guy for a 30% profit or so. It’s been open for a little over two weeks now.

MSFT – Put Spread in March 180/175

This one has been breached. I opened this guy up last week as a bullish move on Microsoft. Everything was looking good until the middle of this week when the wheels appear to have fallen off the Microsoft bus.

MSFT Hourly Charts

Originally, I was looking to get 50% on this guy. If MSFT has a move in my favor I’ll likely get out flat. Otherwise, we’ll wait and see what happens with MSFT. Continued downside pressure will force me to take a loss on this guy.

The 200 hour moving average is right around 175, so I’m hoping it’ll find support and bounce from there…

MSFT Daily Chart

Because if it doesn’t, then it’s a long way back down to fill those gaps and come to previous support levels.

SHOP – Put Spread in Feb 500/490

SHOP Hourly Chart

If you can’t beat them, join them I guess. I had a nasty full loser on SHOP a week or so ago. This guy was a recent add to the portfolio. I’m targeting a 50% winner here assuming that SHOP can stay above 500 for the next week. it looks like it’ll just grind back to that area after that amazing earnings pop.

I’ve been in and out of SHOP since earnings and have cut about 2/5’s of that looser down. Hopefully this one can get another 1/5th or so back in my pocket. I’ve been riding it with call spreads back to the lower strikes; this time I’m playing for a base to be in place.

SPCE – Long Strangle in Feb – 42.5 and 25

I have no idea what SPCE is going to do. I just expect it’s going to move. The 42.5’s cost me $1.5 and the 25’s $1.1. I’m in the trade for $2.6 and don’t see any reason that it’s not going to be worth at least 2x that by the end of the week; hopefully more than that.

My reasoning is as follows:

  1. SPCE has earnings coming up which means that implied volatility is likely going to continue to get pumped into these options. They will go up in price.
  2. SPCE has earnings coming up which means that people are likely going to continue to FOMO freak out and drive this thing higher. There don’t appear to be any fundamental reasons for this – just MOMO.
  3. SPCE has earnings coming up – which means basically it’s going to just be crazy – see TSLA circa 2 weeks ago.
  4. SPCE is on every news feed that I’ve looked at. Everyone is trading it.
  5. All of the college kids are trading SPCE. I’m pretty sure that’s the same as the teller at COST telling me they made money on it….
SPCE Hourly Chart

Secretly (well not so secret now), I am hoping to close both sides of this for $5 each. It looks like in the near term it’s setting up for a nice squeeze breakout and appears to be about to roll over… Then again, it could just shoot back up to 45 before it comes down to 20, who knows?

SPX – Nothing now as they all expired worthless this week again. I’ll continue to scale these. Right now I’m up a little over 100% on this trade this year (return on risk).

I’ll keep these up per the plan. Testing looks good – I need to be patient and let this play out for a while.

SPY – Long Puts at 329, 330 and 332.

My heaviest long position is at 330. These are basically my portfolio hedge right now. I was in an out of /ES during the week with nice success. While I certainly didn’t earn back my persistent short futures losses from the past few weeks, I was able to scalp some nice gains on Thursday overnight and then as it rallied back.

TLT – Iron Condor in March 148/151 139/128

TLT Daily Chart

I’m worried about this one. The short calls have been breached and I think that bonds are going to continue to rip higher. This guy is already at about a 60% loser, so I may need to cut it loose or move up the puts. Given my market posture, I don’t see any reason for bonds to come back down anytime soon.

V – Put spread in March 205/200

V Hourly Chart

This one hasn’t been breached yet, however Visa looked pretty ugly at the end of the week. It’s in an uptrend for now, but it’s a lot less convincing given the week-ending price action. Let’s see what next week brings. If I can cut this loose as a scratch position into market softness next week I’d be pleased. Otherwise, I’ll have to handle it a lot like Microsoft.

VIX – Calls, lots of calls in various months in the future. All well out of the money πŸ™‚ Heavily hedged with VIX calls. Right now, they are up a bit. Let’s see what happens.

XLU – Call Spread in March 70/72

XLU Daily Charts

This one is breached as well. The utilities seem to have quite a bit of strength lately so we’ll have to see what happens here. XLU came down a bit on Friday so that’s encouraging. Theta decay is my friend as is what appears to be an overbought ETF.

XLV – Call Spread in March 105/109

XLV Hourly Chart

XLV looks to be toping out and forming a bit of a double top. I am not sure of the COVID-19 outbreak is good or bad for healthcare stocks. Im assuming bad, and expect this guy will continue to roll over. We’ll see.

SPCE – Parabolic (TSLA 2.0)

SPCE Chart

It’s getting toppy around here.

Who knows if this particular ticker continues to drive higher. Price action right now looks like it certainly will. It fell nicely to the upper moving average and road its way higher today. If this wasn’t a parabolic type of move…

SPCE Yearly Chart - Parabolic Move

Then the hourly price action looks really tradable. Yesterday closed with a red candle, but today was firmly green. It’s looking like maybe this thing continues to defy gravity for a while.

I’m considering another pre-earnings scalp, but just have a hard time pulling the trigger – there just ins’t any reason other than FOMO that this guy is rallying this hard.

With tic-tok videos on day trading options starting to show up. I’m growing more and more confident that a top is near – not just for SPCE but for the market in general. If it’s today or a year from now, I still have no idea.

Speaking of parabola’s how about TSLA and it’s crazy movement – again! The hourly chart looks like a nice long play is in the making but look at that daily just below!

TSLA Hourly Chart

All I can really say is wow; just wow. This is the classic castles in the sky scenario. Elon is smart, and he’s had some success, but this is well – seemingly unfounded and just crazy.

Pulling out my crystal ball – which in reality has zero predictive power – I’m going to say that TSLA is back to 800 inside a week and SPCE rips higher until earnings – after which it craters.

*Note, I’m not about to put money on those predictions yet πŸ™‚

Be safe if you are trading these things. You can make a bunch of money if you go big – but it disappears just as easy as it shows up! If you are selling premium into the types of tickers, be extra careful. You can quickly find yourself in a wildly expanding vol market and price action moving in your favor, yet still lose money.

If I was going to play these, I’d be buying slightly longer dated options. They cost a bit more, but they still get the full impact of delta on price moves. You’ll be somewhat buffered from near term vol decrease/expansion and you’ll get less theta decay.

Just be careful!

Over the last couple of weeks, I’ve had more conversations with people about the market than in a long time. I’m sure some of that is my own excitement with the crazy things we are seeing – however a lot of it is people who are new to trading and are making big (for them) bets on things like TLSA and SPCE.

Again – just be careful! Options and leveraged products can bring tremendous rewards, but they come with much higher risk profiles if not managed correctly.

SPCE – The next TSLA?

I closed out my positions on SPCE today with some GTC orders that I placed on Friday – I certainly didn’t expect those to get filled today!

It’s hard to say if SPCE is having a blow off top before their earnings, or if they are simply baselining into some new normal. The degree of growth in percentage terms is simply crazy. Up north of 150% in just a few days.

SPCE Hourly Chart

Looking at the hourly chart, it’s just on a tear! It’s started to pull back a little bit, but that doesn’t mean much at this point. It’ll be interesting to see how this closes later today. I’m guessing it’s still up, but nowhere near these highs.

Tastyworks has the IV rank at 155 right now and the options chains have some serious vol priced in.

Tastyworks IV Rank on SPCE

Current volatility has this thing expected to move $8 by the end of the week, and $14 by the end of next week. So basically we are expecting this thing to move +/- 40% in 10 days. Wow!

Option Chains for SPCE

I’m unsure how I want to (and if I want to) play this over the next few days. Given the huge move and the 374% profit I just took down on it, it’s likely time to take a small breather on this guy.

Being such a low priced stock, it was really easy to get some very outsized gains; however the uncertainty between now and the earning cycle has the risk up a little more than I am going to be comfortable with.

I suspect the next way I play this next is with puts, but reserve the right to change my mind on that really quickly given the environment it’s currently in. For now, thanks for the profits. Time to wait and watch.

IV Rank and Why it matters

Having recently started back up the blog, I haven’t been super sure of what content would be useful and attract interest. Over the past couple of weeks, I dropped in some google plug-ins to see what search traffic was bringing visitors and one of the top phrases was “Tastyworks IV Rank”

So, let’s run with that and do a quick breakdown on IV Rank and why it is so crazy important!

IV Rank represents the current implied volatility of an underlying relative to its historical implied volatility

For those of you that aren’t into all of the math that makes up the pricing of options, discussions around all of these concepts likely makes you head spin. So I’m going to do my best to simplify what is all is, and why it is so critically important to your trading.

Volitility

Let’s start with what on earth is volatility in terms of stock and options trading. Volatility, or rather implied volatility, is the expected movement of an underlying over a period of time. This is usually captured by the options pricing markets and can be seen for the “general” market using the ticker VIX. Each underlying has its own specific implied volatility which can be seen using a good tool like Tastyworks or Thinkorswim.

Implied volatility basically says that a particular stock is expected to move up or down a particular amount over a specific amount of time.

I’ve over simplified this a bit so for those of you that are experts – specifically this is in relationship to an annualized one standard deviation move in percentage terms in the underlying as expressed by options pricing.

Here are a few examples from the Tastyworks platform starting with a reasonably low “IV Rank” (we’ll get to that later) stock that you’ve likely heard about, CSCO.

CSCO ticker details.

Let’s start with the basics. CSCO today is trading at approx $47 and Tastyworks says that it has an IV Rank of 14.6 as of the close on 2/14/20. This isn’t a stock I would be super interesting in trading right now, and I’ll try to show why and how implied volatility impacts trading for specific stocks. Let’s start with the next month’s option chain.

March CSCO option chain.

If you look at the upper right part of this option chain, you’ll see that CSCO has a current implied volatility of 22.2% which mean that it is expected (within one standard deviation) to move up or down approximately $1.52 over the next 34 days. You can see on this picture that CSCO’s current price is highlighted which the orange line and on the ruler in the middle of the screen that expect move is highlighted as well. Basically if you are trading CSCO today you can expect with ~68% probability that it’ll be valued between ~$44.5 and ~$48.5 in 34 days. That isn’t a huge range, which can make it tough to make much money trading it -especially with options that have strike prices wider than the expected move!

If you wanted to do a simple 30 delta strangle you’d basically have to pick the $47.5 (44 delta) or $50 (15 delta) calls and the $45 (-24 delta) puts. For the $47.5/45 strangle, you’d take in about $1.28 in credit and need to put up ~$887 in risk capital. You’d have a 57% chance of profiting, and approx 72% chance of being able to buy your strange back for 50% profit over the next 34 days.

If you happened to pull that off, you’d make approx $61 per contract on a risk basis of $887 or about 7% return on risk capital.

Jumping WAY out into the future you can see the roughly 1 year away option chain on CSCO below. Notice I had to open up a lot more strikes to show the expected move as well as the one and two standard deviation levels (dashed blue lines). Current implied volatility has CSCO expected to move roughly $7.23 in either direction over the next year. If you are crazy bullish, you could expect it to end up around $57.5 at the high end of a normal movement. These expected ranges will change over time; based upon what is happening in the general market as well as for the specific underlying. In something like CSCO, you can expect that roughly once a quarter, implied volatility will come up a bit (right before earnings) and then come back in after earnings. This may provide interesting opportunities for you to trade – as we will look at later.

Jan 21 CSCO Option Chain

Okay – so now that we’ve look at a reasonably low IV Rank item; let’s take a look at a high IV Rank stock, MSFT.

MSFT Ticker Details

As you can see, the IV Rank is 67.5 which is quite a bit higher than CSCO @ 14.6. But why does that matter? (Patience, I’ll get to it!)

Let’s look at the options table just like we did for CSCO. Here is March, then Jan of next year for MSFT.

MSFT March Option Chain
MSFT Jan 21 Option Chain

Wait a minute! This has an implied volatility of about 27% vs. CSCO at 26% – that’s basically the exact same thing for the next year! Yup.

So looking at MSFT, you see that the implied volatility is about 27%, meaning the expected move is around $9 through the March cycle, and round $32 for the next year. Microsoft is a much higher priced stock at ~$185 so the nominal price moves are greater.

Let’s take quick look at that 30 delta strangle as well. You could sell the $290 call (34 delta) and the $180 put (-34 delta) for about $6.65 in credit and you’d need to put up $3,240 per contract. The probabilities are 55% probability of profit, and 75% probability of being able to sell it for 1/2 the credit. So let’s see what that looks like. 1 contract, let’s say you only got $6.60 for the strangle and bought it back for $3.30. So $330 profit over $3,240 in buying power for a return on risk capital of about 10%. That’s a bit nicer than the CSCO 7%. Crazy huh!

IV Rank

So why on earth would two stocks with basically the same implied volatility have two totally different IV Ranks? I have to go away from Tastyworks for a moment to show you why – and I’ll use my IV Rank tool on TOS.

In a nutshell, IV Rank is the position of the current implied volatility relative to the historical implied volatility for the underlying security. Typically this is over the last year of observed implied volatilities.

Note: My calculations on TOS are not going to be the same as the ones on Tastyworks. The Tastyworks team has done a great job of building a real-time calc that is way more accurate than what I can do in TOS.

First, let’s take a look at CSCO. This chart is kinda difficult to read, but it shows the general change in implied volatility for CSCO over the last year or so. As you can see, it jumps around a bunch! It’s been as high as about 44% and as low as around 14%.

To make it simple, if you said that the range of CSCO’s implied volatility over the last year was between 14 and 39, or roughly 25 percentage points wide. The current IV is roughly 33% in the range from 14 to 39.

CSCO IV Chart

Simple eh? Okay, maybe that didn’t make any sense. Let’s try it slightly differently.

For CSCO, the highest implied volatility observed over the last 12 months was 38.95. The lowest implied volatility was 13.8. That gives us a range of 15.15 percentage points difference between the top and the bottom of the observed implied volatilities.

If we look at the current implied volatility of 22.15 and subtract the lowest observed of 13.8 we get a current implied volatility that is 8.35 percentage points above the lowest observation.

If the range of the highest to lowest observations was 25.15 percentage points wide, the current reading of 22.15 is 33.2% into the range.

Okay – one more time, maybe as a set of variables:

  • Lowest = 13.8
  • Highest = 38.95
  • Current = 22.15
  • Range = Highest – Lowest = 28.95 – 13.8 = 25.15
  • Position = Current – Lowest = 22.15 – 13.8 = 8.35
  • IV Rank = Position / Range = 8.35/25.15 = 33.2%

Makes sense? Good!

Let’s take a look at MSFT.

MSFT IV Chart

Oh, that’s interesting. That chart looks a little different. It looks like the implied volatility has climbed a bunch recently relative to the normal ranges for MSFT.

  • Lowest = 16.91
  • Highest = 32.56
  • Current = 27.96
  • Range = 15.65
  • Position = 11.05
  • IV Rank = 70.6%

Why does this matter?

Think about it for a moment. If you are selling premium, and option prices are based upon the intrinsic value, time and volatility (roughly) – then you want to sell when the price of volatility is higher relative to the normal price of volatility for an underlying security.

If you look back and the CSCO chart, you can see why this matters. CSCO just had an earnings event, in fact it was on the 12th of Feb 2020 after the bell. So let’s pretend that I wanted to sell a 30 delta strangle before earnings on CSCO.

We can use the really cool “OnDemand” feature in Thinkorswim to go and look at the historical pricing for this example. Pretty neat really. This is option pricing for CSCO on 2/12/20 @ 10:45 am EST.

CSCO Historical Options Quotes

The 30 delta strangle on the 12th would be the 52.5 call and the 47.5 put for a credit of $1.45. Notice that is now a wider strangle (5 points, vs. 2.5 points) and I’m taking in more credit $1.45 vs.$ 1.28 today.

If you had sold the 52.5 call and 47.5 put strangle on the 12th for $1.45, you could have bought it back for $1.38 on the 14th even though your strikes had been breached. The contraction in implied volatility made a loser into a winner. CSCO is currently below your short put, the stock has moved against you by roughly 6% in a day and you still have a 5% winner on your hands.

Let’s go the other way and maybe you just had the brilliant idea that CSCO was going to come done to $47 by Friday. So you decided to simply sell a call spread, how about the 50/52.5 call spread for $0.97; today you could have bought it back for $0.16.

Maybe you prefer Iron Condors, so you sold the 50/52.5 by 47.5/45 for $1.41, you can again buy it back for $1.07 today.

All of this is because implied volatility today relative to implied volatility a few days ago is way lower.

Other than the call spread (which is basically cheating because I know what happened), every one of those non-directional strategies had a move strongly against the position. They are also all profitable.

Please don’t mis read that to think that all earnings trades are profitable. I had a max loser this last week as SHOP blew through expectations. I used a spread, it got smoked and no amount of volatility contraction can fix that.

Wrapping a bow on it

Hopefully this long meandering post about IV Rank is helpful. In a nutshell, IV Rank represents the current implied volatility of an underlying relative to its historical implied volatility. You generally want to sell premium when implied volatility is higher than when it is lower.

Selling premium in low IV Rank underlying’s is extremely difficult as your “edge” as an options trade has all but evaporated.

Trade Log – Week ending Feb 15 2020

ES Open Chart

Futures opened nicely down on Sunday, so I got extra short as planned.

Look at that amazing little slice of the chart to the left. It’s pushing down and dropping like a rock! Exactly what I’ve been licking my chops to have happen as we all begin to recognize the “perfection” priced into the market and the real risks out there in the economy.

What I guess was unplanned was that by the time we closed on Monday there would be a more than 30 point swing in the /ES to the upside… Ouch, again. Just to pour salt on my woulds, we went to all time highs, multiple times (as they say on Tastytrade, it’s great for my 401k…). Below you will find the 30 min /ES for the week. I got extra short at the really low point on Sunday night.

ES Weekly Chart

It’s become abundantly clear to me that my ability to “time a top” is basically zero. So, I think it’s time to simply trade the price action and stay with what has been very successful for me over the years. Back to basics, back to the rules, back to appropriate position sizes (for the most part).

I was fairly busy with trades this week, but also extremely busy at work. I missed a few setups that I had planned to get into and was a bit disappointed about them. The biggest was ROKU. I was planning to drop an Iron Condor on for earnings and just missed it due to some work obligations. That would have been a sweet winner, to offset the awful loser I had in SHOP this week. SHOP turned into a max loss for me as it simply blew the doors off of earnings and I was on the wrong side of that trade! I think I held it for a week or two as it simply ripped higher; after that 50 point earnings gap there was’t much more management I could do to save that mess!

My portfolio is currently positioned to need a big move in the market. I still have a lot of SPY positions as I’ve been trying to chase a top for the past few weeks. If the market doesn’t come down a bunch in the next 7 days or so, I’ll have to realize some very sizable losses. I’ve put some longer term calls on to offset some of those should we continue to grind higher. Given that those are all debit positions, I’m losing theta every day so the worst thing that can happen to my SPY positions is for the market to just grind. I need some movement!

Throughout the week I really focused on cleaning up positions that where in the last parts of their lifecycle. Things with less than 14 days till expiration. A lot of those positions had nice moves that brought them back into profits and allowed me to close as winners. These included GLD, EEM, UNG and XLE.

I opened a slew of March positions in XOP, SPY, DIS, V, CMG, MSFT, TLT, GLD, EEM and XLE. These are either iron condors at approx the 30 delta short strikes, or credit spreads for things I have a directional bias on. I throw the long put and call on the condor to simply define the risk for allocation purposes. I’m sure it creates a drag on returns over time, but it’s saved my bacon enough times that I tend to avoid undefined risk straddles or strangles; preferring Iron Condors or Iron Butterflies.

For earnings this week, as I mentioned above I got nailed by SHOP however I had a nice winner with LYFT.

I was also in and out of a few TSLA and BYND positions throughout the week. None of those were sizable winners, however they all had small gains.

I did finally close out my BUD position for a pretty big loss. I’m not sure what happened to BUD over the last week or two, unfortunately that winner turned into a realized loser. I closed out SAFM, STNE, INTC and some others for a mixed back as well.

The last two weeks, it’s been clear that I’ve over traded a few tickers and it’s showing in my P&L. The positions sizes I’ve taken have been too big on a few key big mover names, and I remain over sized on SPY. If the market comes down hard next week, I’ll make a killing – however if it doesn’t I’m going to lose a mint. I had realized gains of more than 10% in January, and at this point I’m down to around 2% realized and I’m sitting on enough unrealized losses to pull my entire portfolio down to about -5% for the year. Position sizing matters, and I’ve gotten loose on it over the last couple of weeks. There isn’t much I can do to “fix it” right now in terms of existing positions, so I’ll be focusing on proper risk management to recover this little mess-up and get firmly back into the green over the next couple of weeks. I don’t expect it’ll take too long; however it’s a shame to give back money when you don’t need to.

For a long time, I’ve used a simple fixed dollar max risk method to limit losses in credit spreads, and I moved away from that on a few trades. I’ve also been buying far more options outright than I normally do. The combination of this two things has lead to some more rapid profit decay that I typically realize.

SPX selling was again totally profitable this week. This week I scaled with volume vs. spread width. I think I’ll stay in this mode for another month or two as I continue to build capital in test accounts. At my next scaling cycle, I’ll switch to scaling with spread width in the IRA account I’m trading this in, and continue with volume in the margin account I am also using. It’ll be interesting to see how those two different scaling modes work out over time.

Oh yeah, my biggest loser for the year is now /ES; by far. I’ve simply been on the wrong side overnight as the fed pours money into the system and the market rips higher. I’m also apparently a sucker, as I put in an order to sell more at 3380 Friday into the close. Guess who got filled and is short again into the weekend… maybe I’ll learn, or maybe I’ll start eating into those losses as we all wake up to the fact that Covid-19 isn’t going away anytime soon and there will be a major drag on economic activity as a result. Then again, if the fed keeps this up I’m not sure it’ll matter too much.

Fed Balance Sheet
Source: https://www.zerohedge.com/markets/sp-futures-hit-new-all-time-high-coronahope

Be safe out there trading! It’s hard to be a contrarian with so much liquidity being pumped in!

Trade Log – Week ending Feb 8 2020

Ouch! Was I wrong or what!

This week was nasty, and nasty in all the ways that hurt my P/L statement.

To quote myself from last week: “Personally, I think we are still pretty over extended in the near term and will see a correction sooner rather than later.” Well sooner wasn’t the week ending Feb 8th as the market reached all time highs again; all the while I was short /ES.

This week I cleaned up a bunch of long delta’s for profits…. LOL! Again, to quote my very wrong self: I’ll be looking to take quick profits on any of these positions that I can to basically β€œget flat” and then reposition accordingly.” I guess the good news is that I was able to capture those long delta’s for profits. My portfolio is now very short delta and positioned how I’d like it. I’ve realized more than 10% gains this year; however I’m sitting on enough unrealized losses to wipe those out in a heart beat. These next two weeks will be very important for the positions I’ve got sitting around – I’m positioned for a drop (loaded up last week), and if it doesn’t occur I’ll need to manage aggressively.

I closed positions in XBI, FXI, XLV, BKNG, INTC, ZM, TLT, FCX, DIS (2x), IRBT, FB, UBER and of course our friend TSLA for profits :). Yes – I’m a sucker and I got back into TSLA. The parabolic move was just too enticing to not fade it. I played it with 0DTE’s on Friday along with a few other ones during the week. I didn’t come anywhere close to unwinding the face ripping damage from a few weeks ago, however I was able to lower the pain during the week :).

So far for the year I’ve done the best with BYND, SPCE, NFLX, DE, VB, DIS and ZM. These have all been very nice trades and have contributed to some really nice profits. TSLA, BKNG, CVNA and AAPL have been my bad guys – all having breached expected moves much more than I thought, and I was just on the wrong side for sure! Oh yeah, and there is /ES with my very short bias for weeks and markets ripping higher – that’s my biggest loser for sure; for the year.

The market still looks extremely over extended to me. It’s odd to see TLT so strong with the SPX so strong; given the negative correlation something smells fishy. Outside of AAPL, AMZN and MSFT the QQQ’s don’t seem to have much holding them up – although those three tickers make up a sizable amount of the Nasdaq.

Right now I’ve got positions open in AAPL, BA, BUD, BYND, CMG, EEM, FDX, FXI, GLD, IBM, INTC, SAFM, SDC, SHOP, SPCE, SPY, STNE, TLT, UNG, VIX, WMT, XBI, XLE and XLV – that’s a bunch! Its about a 1/3 profitable, 2/3 unprofitable split right now with my biggest pain being in the SPY (very, very short bias) and BA (that thing turned against me hard this week).

I’m still short /ES into the weekend. The Coronavirus news doesn’t look like it’s getting any better and it wouldn’t shock me for a minute to see the market sell off hard again – the plethora of Feb 21 expiration SPY puts I have hope it occurs in the next 13 days πŸ™‚

SPX selling was nicely profitable again this week even though the markets moved quite a bit. My favorite little statement in my transaction log is Removal of XXXXXX due to expiration when it is for profitable selling of options. Friday was a bit worrisome for some of my positions as the SPX dipped into my short PUT wing for a bit – however closing is all that ultimately matters on those!

Plan for next week – ideally we have a strong pull back and I can remove some risk from the portfolio; If not, I’ll be adding some more long delta’s to neutralize my current posture. Although I just don’t see how we keep going up; the price actions is what it is. I will likely close my /ES shorts on Sunday night if the market doesn’t open down a bunch; I’m holding on for something I think will happen and if it doesn’t materialize that trade is simply a really bad (and expensive) trade. If the market goes down, I’ll add to the short position – yes I’m a glutton for punishment.

Trade Log – Week ending Feb 1 2020

The market continues to move around like crazy! The fears of the Coronavirus wiped out all of the January gains on Friday which was not horribly unexpected. Personally, I think we are still pretty over extended in the near term and will see a correction sooner rather than later.

I got my faced ripped off in TSLA this week after they simply blew out earnings and the stock shot up like a parabolic rocketship. I was short call spreads from 560 – 640 and they basically all went ITM almost over night. Rather than try to manage my way around it and sell puts and work it all, I decided to simply close out and take some losses. I’ve found that for me, I tend to want to revenge trade things like that I it ends up turning out very poorly. I’ll come back and check on TSLA in a while, for now I have no idea where it’s going to go as $650 seems totally unreasonable and simply based on castles in the air.

My little SPX selling test was fully profitable this week. I’ve doubled the size of it and will continue to test it in the markets throughout the year. So far, it’s working nicely. Even with the major sell off on Friday, I had no problem finding enough premium to safely be outside of the range for the day.

My portfolio is currently much longer in delta that my market posture. I’ve got long delta positions basically across the board on BA, BKNG, CRWD, DIS, EEM, FXI, GLD, GM, SMH, UNG, WYNN, XBI and XLV. My only short delta positions are on AAPL and INTC. Given that I expect a correction soonish, I’ll be looking to take quick profits on any of these positions that I can to basically “get flat” and then reposition accordingly.

I closed out a bunch of ITM TLT calls due to assignment risk with the ex-dividend date being Monday. I don’t have any desire to be short bonds right now, the market seems ready to go down and I’d rather be short for the near term.

Trade Log – Week ending Jan 25 2020

I personally love it when the market gets a little crazy! It’s fun to trade things up and down and make some money in the process.

Tuesday morning I was able to load up on some new positions, a 20/10 “big lizard” on NFLX for a $12.36/contract credit with no upside risk (that was a nice earnings play) as well as a few longer term iron condors on IWM, IBM and XBI.

Given the market has been on a relentless tear north, I did open a few directional debit spreads on PLNT, WDAY and DE along with a few credit spreads on CRWD, X, INTC and TSLA. The PLNT and WDAY positions I closed this week for a loser and winner respectively.

TSLA Chart

Call me crazy, but I just cannot see how TSLA (above) doesn’t just come crashing back to earth. It’s way out in front of every expected move and is jittering around like crazy over the last week or two. This appears to be the classic short squeeze chart; however the “settled” (if a 10% range is settled to you…) pricing over the last three days does give me a bit of pause as it is starting to look a touch more orderly. I’m carrying a lot of negative delta on this guy and am planning to hold through earnings if it doesn’t drop before then. I’ve got a couple weeks after earnings for the positions to come back in if I’m wrong… and IV crush to help out (I hope).

INTC Chart

Speaking of being totally wrong. I did try to get cute with INTC earnings and opened up a couple of positions – one of which I had to close for about 1/2 of max loss. I sold an IC outside of the expected move on this weeks’ weekly options (1 DTE when opened) and when INTC launched up after earnings, it was time to get out quickly before things got really ugly at expiration! I plan to ride out the remaining spreads that are in Feb and March cycles as the market moves around. I’ve got one with short strikes at 67.5 calls and 58 puts and another that is just a short the 75 calls. Hopefully the market will settle a bit at my 67.5 calls will be out of the money as we move into the month of Feb. The IV crush and slight market contraction early Friday morning was a huge help on the quickie condor – It was a 1 point wide 67/68 call 60/59 put IC for $0.29 with 1 DTE. I ended up getting out for a total of $0.69 per contract and left the long 59 put to expire worthless.

Given the little bit of market swoon we had on Friday, some open orders I had on filled and I was able to load up a few more positions in EEM, XLV, FXI and TSLA.

As the week closes, I’ve got about 19 tickers with open positions on which is not too bad of a mix. Next week I’m hoping we see some serious 2 sided action and I can start getting a few more things going – my watch list is long and ready to action on πŸ™‚

SPX Chart

While I was cranky about it last week – persistence in holding futures contracts paid off nicely this week (yes, I held the short contracts all week long). I was able to get out for a reasonable profit on Friday and then got short again just after the market closed over the weekend. Right now, that position has a nice little profit and I’m expecting with the Coronavirus concerns that we should see more market weakness into next week.

Looking at the chart of the SPX, it looks ready to just roll over. At a minimum I’d expect it to come back down to 3250, and quite frankly 3200 isn’t too far out of the question to close the gap from mid December. That’s only 3% away and with the virus concerns and maybe an earnings miss or two from the big players, it’s very possible. With AAPL on the 28th, TSLA the 29th and GOOG on the 3rd of Feb we have a couple of heavy hitters coming in soon. Not to mention V, MA, MCD, SBUX, AMD, FB, MSFT and AMZN… Yeah, it’s kind of a dense week :).

My little SPX experiment was also successful each day this week. I’m getting far more comfortable with how it’s working and plan to use the returns it is generating to scale up throughout the year. Right now I’m planning to scale with contract sizes; however I may widen out the spreads vs. more contracts and play the 2 different versions in different accounts to see the results.