This evening, the Federal Reserve dropped the discount rate to 0%-.25%. The FOMC met this weekend and have cancelled the planned meeting later this week.
I’m not extremely surprised; however it’s not going to fix the underlying problem.
As I type this, the futures markets are limit down effectively across the board. With an almost 10% up day on Friday, I expect we will see the next leg down starting tomorrow.
Fiscal stimulus is certainly on deck soon, however I’m not sure it will do much to mitigate the downward pressures that we are experiencing due to the Coronavirus. Once a fiscal package is passed, I expect it will provide a near term rip higher, but that’ll be short lived.
As of right now, the FOMC is holding pat on not going to negative rates. The Fed is very likely going to expand QE is a material way, this is just the first step.
Fox Business asked a great question that the Fed chair dodged expertly on the call regarding buying “other assets” simply stating that they do not yet have the legal authority, and are not asking for it yet.
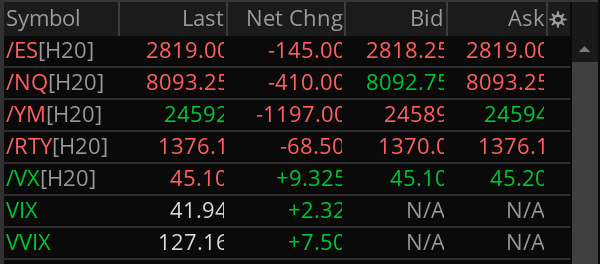
Monday looks like it’s going to be quite the ride. As I type this late Sunday evening, the /ES dropped like a rock and is basically pinned to limit down; treasuries have fallen to sub .5% on the 10 year, the 30 year is below 1% and oil has cracked $30…
Absent some sort of intervention, we are experiencing a real crisis and may see a true crash tomorrow and into this week.
Circuit breakers:
Assuming the Fed doesn’t jump in tonight, I wouldn’t be shocked to see a Level 1 halt, possibly even a level 2 halt tomorrow. For those of you that aren’t aware of these basically they work as follows:
Level 1 – At a 7% down move, trading stops for 15 minutes (if it happens before 3:25 PM EST)
Level 2 – At a 13% down move, trading stops for another 15 minutes (if it happens before 3:25)
Level 3 – At a 20% down move, trading is halted for the rest of the day.
If you want more info: CME Group has futures info here, CNBC did a piece a few years back here and of course the SEC has the final word here.
Given the recent intraday price movements we’ve seen, and that /ES futures are locked limit down at 5% on the Globex session, another 2% at the open seems very possible.
The speed and size of these moves over the past week have likely resulted in liquidations and a few firms “blowing up” as they cannot cover margin requirements due to vol expansion, gamma risk and all of the related problems that come with these massive moves. With /CL, /ZN, /VX and /ES doing what they are doing tonight – more liquidations tomorrow seems very possible – and that means more downside pressure.
Be safe and manage your risk sizing!!! As I write this:
It’s not looking good for tomorrow’s opening, or likely the next couple of weeks…
Today the Federal Reserve cut the benchmark rate 50bps in a “surprise” move. After a G7 summit this morning, nothing was announced. Then at 10:00 EST they did a random press release to say that the rate will change; weird at best. The effect was very brief – generally speaking the markets hated it.
On Sunday I wrote a piece about how I expected the Fed to cut rates this week, and they delivered. My forecast of the reaction was quite incorrect for the timing, and as a result my plans to trade it are a bit off kilter and I’m adjusting accordingly.
Yesterday, after the nice bounce in the major indexes, I sold a few near the money call verticals on the SPY. These were quickly closed after the Fed announcement (for a loss) as I expected the market to rally hard and hold for a day or two. Unfortunately that forecast was way off and today turned out to be another 50+ down move in the S&P’s which is driving my slightly positive skewed portfolio into some serious red territory.
Those SPY short call verticals would have been very nice given the sell off today. I checked the pricing right around market close (because everyone likes to understand what they missed out on) and I had roughly 50% gains in the bag (woulda, coulda, shoulda – didn’t).
At this point, it’s time to trim positions that have little to no hope of recovering given my current market forecast. I’m rotating through some positions and realized losses on UVXY spreads that are unlikely to come in over the next week, also closed out some deeply breached ITM put spreads. With vol continuing to expand, /VX continuing to rise, the market totally shrugging off a Fed rate cut and COVID-19 cases growing exponentially I just don’t see a near term bullish case that makes sense.
The rotation of new positions are mostly bearish in tilt. I’m picking a few equities, but going more towards 16 delta calls on indexes to give plenty of room for volatility and allowing things to get deeply out of the money for quicker profit taking on drops. I’m holding some longer term short vol positions for a bit; we’ll see how those play out.
We may get a few relief bounces in the next few days as we grind lower – however I’m not interesting in letting my existing ITM put spreads go any deeper ITM given the short amount of time that is left on them. I’ll take the residual value and use it for some profitable trades instead 🙂
Coming back to the rate cut for a bit. The cut today puts the fed in a really awful scenario at their March policy meeting. They cut, and it didn’t do anything in terms of helping the market. The market is basically demanding another cut with the price action and the fed is almost obligated to do another 25 bps (minimum) at the March meeting. It doesn’t really do anything to help the actual problem, it is largely symbolic at this point. Possibly buffering potential demand shocks as a bit of early insurance against them – but that remains to be seen.
In 2008 credit conditions were actually messed up. We had real financial problems in the economy and monetary policy was an appropriate tool to aid in addressing the problems. Given a growing potential global pandemic, rate cuts don’t do much if anything to offset supply shocks. Possibly expanding the balance sheet, offering lending facilities directly to firms and other market operations have some impact; but lowering the funds rate, I just don’t see that being meaningful. Most of their tools address the demand side of the equation.
Furthermore, the Fed just shot their bullet. They really only have a few of them before we hit the zero bound on the funds rate – and unless the US is prepared for negative rates, it’s time to start getting creative with monetary policy.
Maybe this is a play to say to the policy makers – we did our part, now you do yours. I wouldn’t be surprised to see stimulus packages come to play later in the year as we continue to experience economic drag due to COVID-19.
Stay safe out there and keep your risk in check! The markets are whipping all over the place and you can lose your shirt in a heartbeat if you don’t manage your risk appropriately!
Last week marked one of the most aggressive, and orderly sell off’s that we have ever seen in the markets. It was however not a crash.
Market’s do crash, and when they do it is disorderly and pricing moves are vicious. Friday was the closest thing we saw to a crash, however the buyers stepped in (my guess is to cover their short positions) over and over throughout the day. If we drop more than 5% in a day we are in a real true crash type of situation – we have seen an orderly repricing of risk.
However, liquidity appears to be drying up, and the market for all intents and purposes appears to be ready to simply puke on itself sometime in the next few weeks. Futures this weekend opened with the /ES down another 30ish points; I wouldn’t be surprised to see that continue to have downside pressure unless something changes overnight – possibly bringing another 100 point down day in the SPX.
News of the COVID-19 spread is all negative. The United States experienced the first death directly related to COVID-19 and there appears to be a cluster of new cases forming on the east coast. Given that information, along with the news that the Washington cases could have been spreading for weeks it is a virtual certainty that we will have a massive spread of COVID-19 across the US at this point.
If the future response to the spread in the US looks anything like it has in other countries, we are in for severe demand shocks and quarterly earnings are going to tank for many, many firms. The market understands this, and appears to be absorbing this possibility; if it begins to materialize… look out below.
Markets are pricing almost 4 rates cuts in at this point – and honestly, I was a bit surprised that the Fed didn’t step in before the futures opened this weekend. While central banks can’t cure a virus, they can inject liquidity, lower rates and show accommodative policy to ease financial frictions.
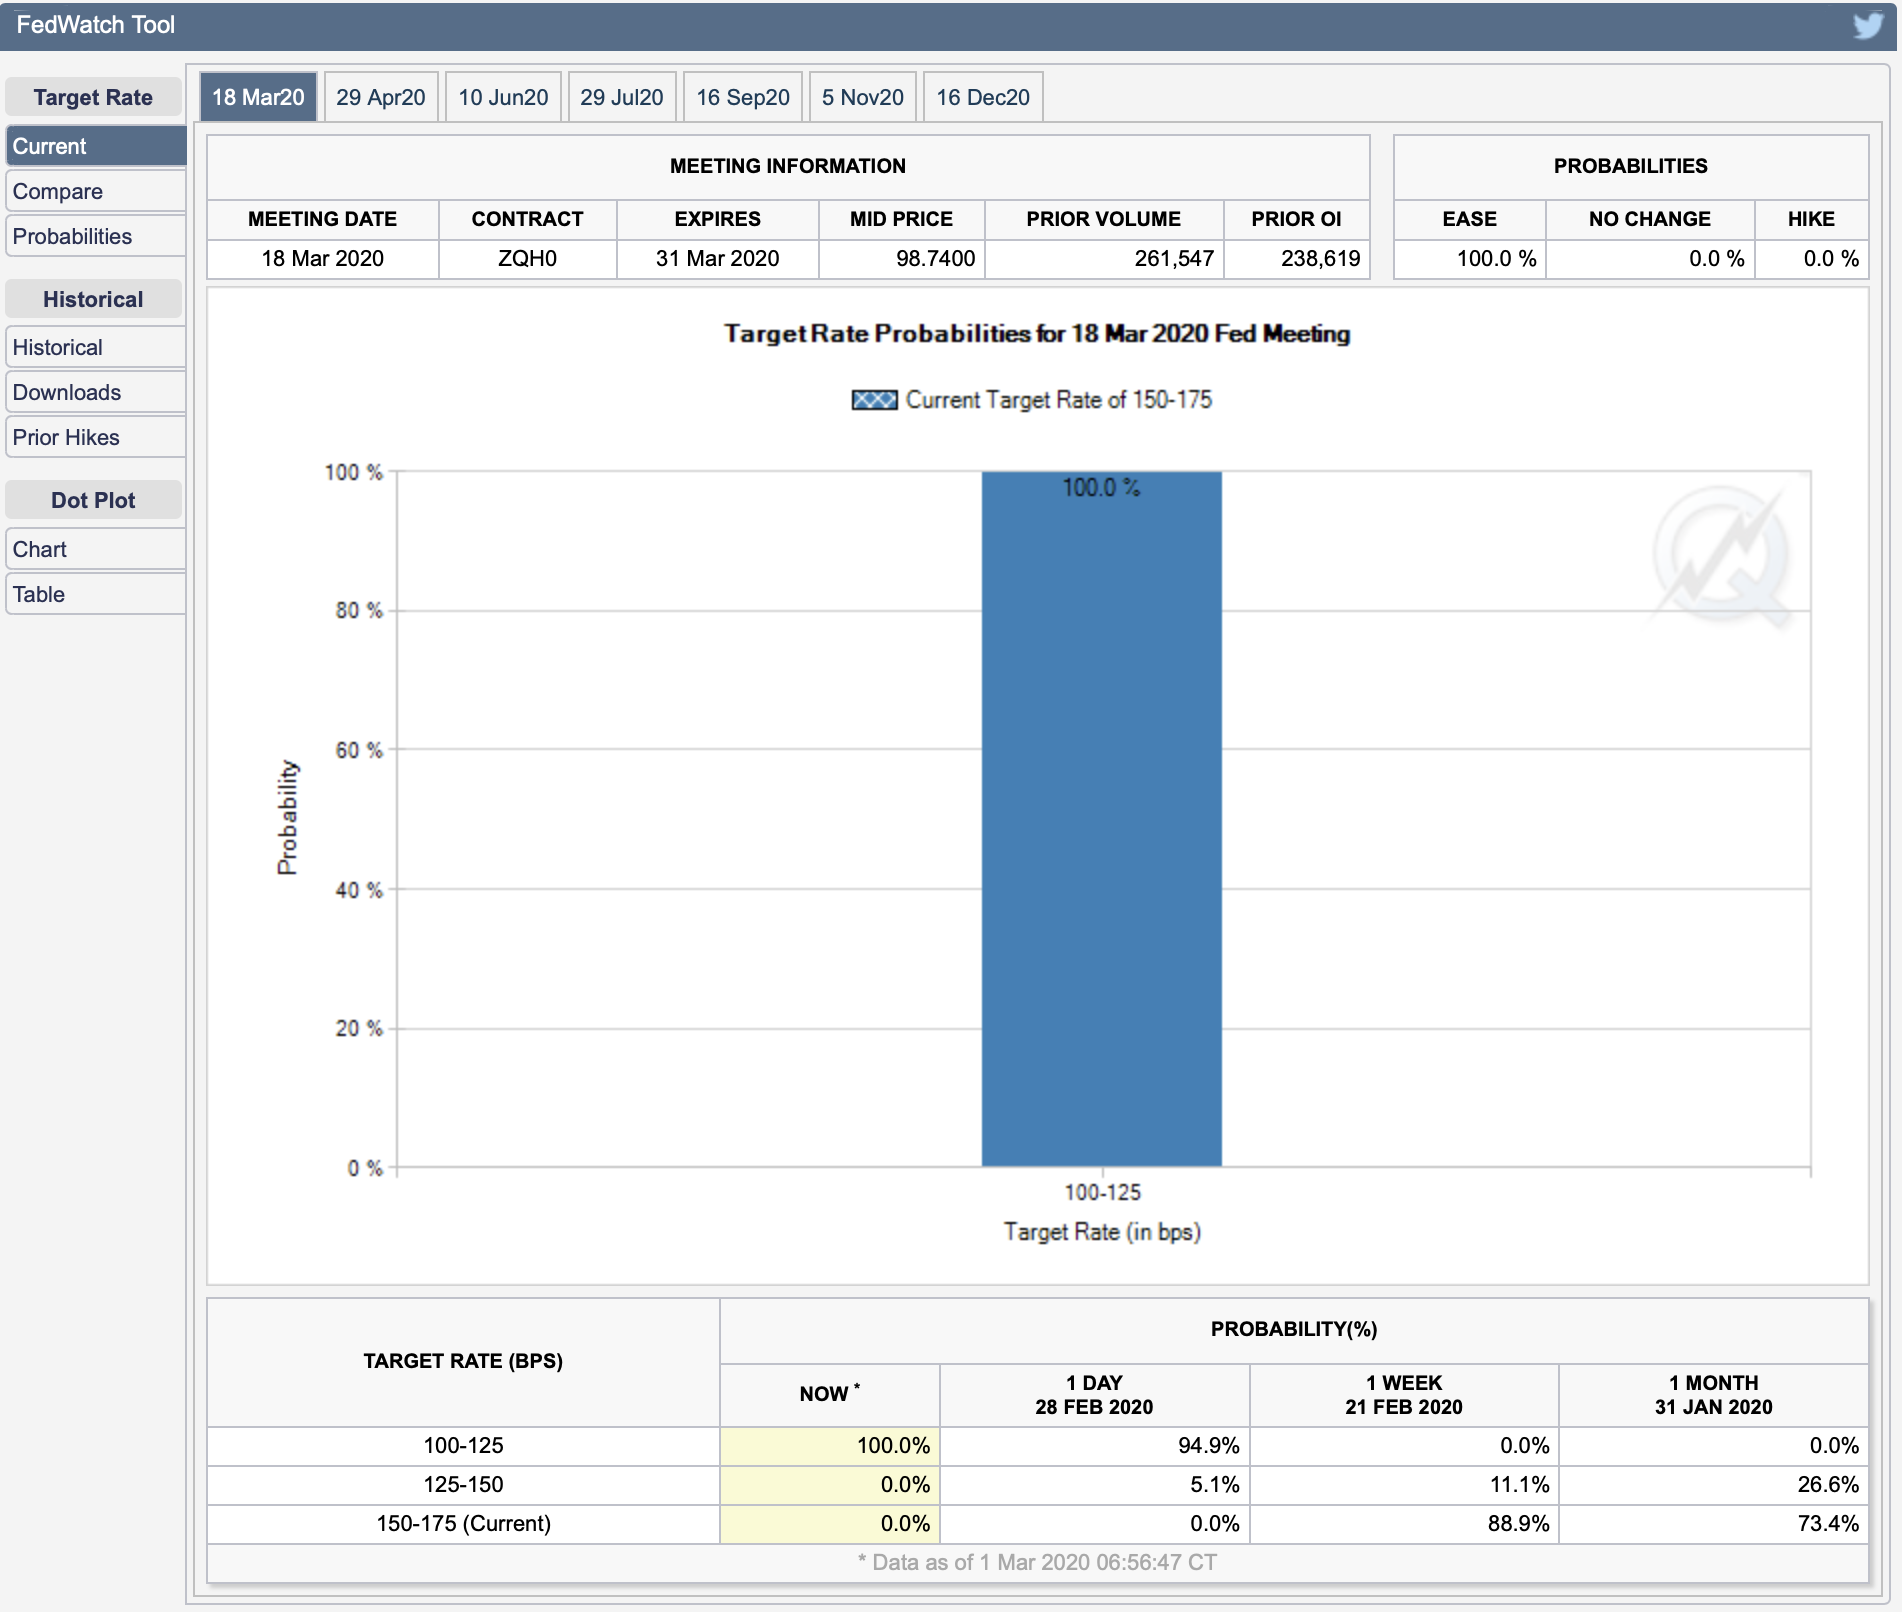
The CME has a nice little tool called FedWatch – it’s pricing a 100% change of a cut at the next meeting…
My guess, in the next seven days – central banks across the global begin a coordinated effort to “ease” financial conditions. That leads to a wicked near term jump in the markets and a tremendous selling opportunity.
I’m planning to continue to remain nimble and trade the tape as it develops.
Unless you’ve been hiding under a rock for last the last few weeks, you’ve heard all about the panic that is the Coronavirus a.k.a. COVID-19. It’s possibly a really scary economic reality that will hit the global system over the next few quarters, and you should begin to prepare yourself and your family. I’m not a doctor, or virus expert – so I’ll leave those things to the professionals; I am however quite proficient at budgeting and believe firmly that having a strong budget in times of crisis is critical.
Budgeting is actually really simple to do. It’s scary for those that haven’t done it before, and can feel stifling if you don’t wrap your mind around the reality that having control and oversight of your finances gives you a ton of freedom!
At its core, a budget is a simple plan that is created to direct spending and provide visibility to areas of spending. Budgets are one of the most effective and simplest ways to manage your money, build wealth and create freedom.
You don’t need to make six figures or have millions in the bank to have a budget. In fact, if you find yourself living paycheck to paycheck – it’s critical that you get a budget in place immediately. Without a budget, your ability to get away from living paycheck to paycheck and moving toward financial independence is critically hampered.
You can make a budget on a napkin, in a journal, using a spreadsheet or with any number of fancy pieces of software. I’ve made no secret of my support for You Need a Budget, and would strongly suggest you check it out if you’re interested in the software route.
If you are ready to start…
The first thing you need to do is get an understanding of what you actually have.
I’m a fan of budgeting cash in your possession, not what you think may show up in the future. I’ve been burned enough times in my life with poor forecasting to realize that cash in hand budgets are way more effective than ones that anticipate a reality that may not materialize.
Please note, I’m not suggesting here that you avoid longer term financial planning and the like; I just view that type of work as very different that your daily operational personal budget.
To get started here, it’s pretty simple. Open up your wallet, your bank register(s) and your savings account(s) – add up the money and write it down.
Let’s pretend that you have the following situation:
Wallet: $150
Online Checking: $300
Online Savings: $250
Other Savings: $500
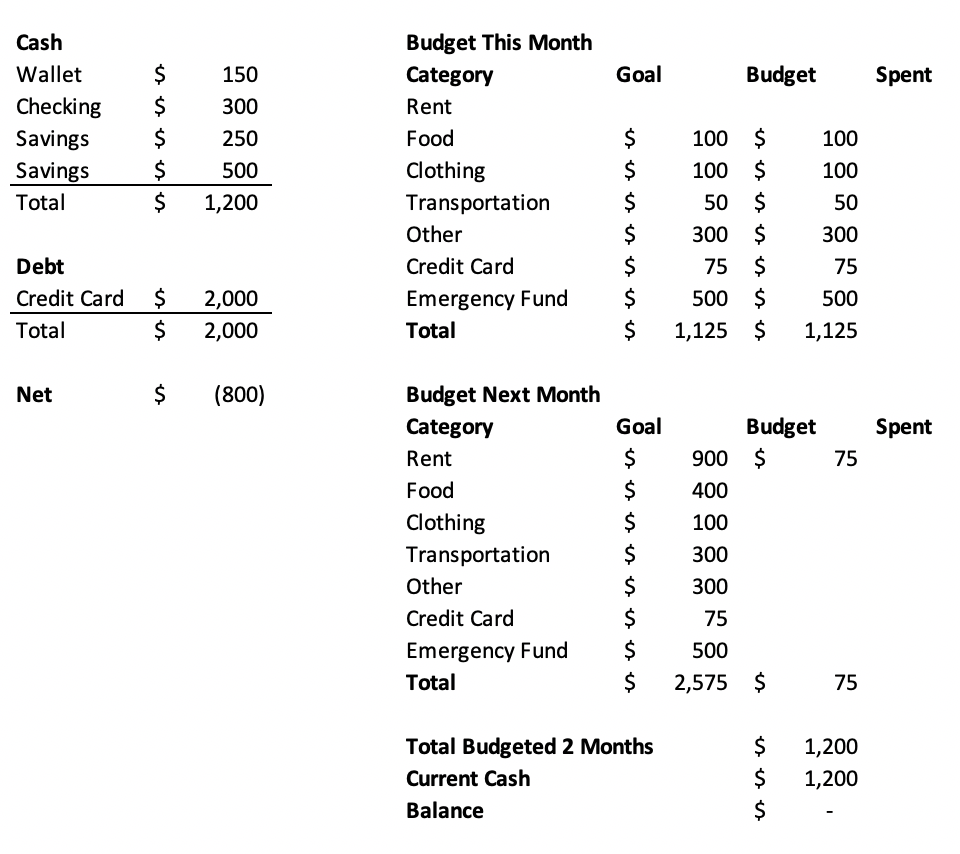
If you add all of those accounts up, you’ll find that you have $1,200 in cash. That’s a great thing to know and to have as you look at the next piece.
Once you understand what you have, you need to understand what you expect you’ll need and start to allocate what you have. I’ve found the simplest way to do this is to look through your bank and or credit card statements to see what you spend. If you spend a lot of cash, it’ll be tougher to be exact and you’ll have to guess a bit.
You can think of your historical spending as a “goal” of funding for each month. You may want to try and lower the spending, or increase it – regardless having a target is crazy important!
For sake of this example, let’s assume the following:
Rent: $900/mo (already paid this month)
Food: $400/mo (already spent $300 this month)
Clothing: $100/mo
Transportation: $300/mo (already spent $250)
Other expenses: $300/mo
Credit card payment: $75/mo (Balance: $2,000 – vacation was great…)
Given that you’ve already paid a bunch of your expected monthly expenses, your first task is now to allocate that $1,200 of cash and give it a job! Personally, I like to have jobs that are not just to cover my expenses, but also for important things like emergency funds etc…
Okay – so let’s get the first “budget” up and running for the remainder of the month:
Emergency Fund: $500
Food: $100
Clothing: $100
Transportation: $50
Other expenses: $300
Credit card payment: $75
At this point, you’ve budgeted $1,125 of the $1,200 in cash that you have! That remaining $75 should get a job right away, and if this was my personal situation, I’d put it immediately toward next months rent chipping away at the upcoming payment of $900.
Next month Rent: $75
Boom – now you’ve budgeted all of the cash that you have and can start to get a feel for what you need in the next month. You know right away that you need another $825 to pay the rent, and then can start to fill up other categories right away as you get your next paycheck.
Here is a quick snapshot of what this might look like in a spreadsheet:
You can get way more complicated for sure but this is a simple way to start! You can start to track your spending in your spreadsheet and do a little math to see what is left as the month goes on.
Eventually, this gets pretty complicated in Excel – so again I’ll plug YNAB 🙂
Putting it in practice
With your newly minted budget – it’s time to use it! If your buddies give you a call and suggest a road trip for the weekend, including hotel and an expensive micro-brew round up…. you get to make an informed choice.
You can quickly look to your budget and ask: Do I have enough cash today to enjoy this trip? If you have the cash, and it’s in the right categories – then have a great weekend! If you find that you have the cash, but you’ll need to raid another category, you know can make an educated decision on what is more important to you – and you can start to get control of your spending very quickly.
Why does it matter?
For me personally, I’ve found that without a plan – money tends to disappear. It gets spent on frivolous things, and that can create situations where important things get put at risk.
Given some of the uncertainty facing our economy for the next few quarters, now is a great time to get a bit of control and start to make informed choices in how you spend you money!
Having recently started back up the blog, I haven’t been super sure of what content would be useful and attract interest. Over the past couple of weeks, I dropped in some google plug-ins to see what search traffic was bringing visitors and one of the top phrases was “Tastyworks IV Rank”
So, let’s run with that and do a quick breakdown on IV Rank and why it is so crazy important!
IV Rank represents the current implied volatility of an underlying relative to its historical implied volatility
For those of you that aren’t into all of the math that makes up the pricing of options, discussions around all of these concepts likely makes you head spin. So I’m going to do my best to simplify what is all is, and why it is so critically important to your trading.
Volitility
Let’s start with what on earth is volatility in terms of stock and options trading. Volatility, or rather implied volatility, is the expected movement of an underlying over a period of time. This is usually captured by the options pricing markets and can be seen for the “general” market using the ticker VIX. Each underlying has its own specific implied volatility which can be seen using a good tool like Tastyworks or Thinkorswim.
Implied volatility basically says that a particular stock is expected to move up or down a particular amount over a specific amount of time.
I’ve over simplified this a bit so for those of you that are experts – specifically this is in relationship to an annualized one standard deviation move in percentage terms in the underlying as expressed by options pricing.
Here are a few examples from the Tastyworks platform starting with a reasonably low “IV Rank” (we’ll get to that later) stock that you’ve likely heard about, CSCO.
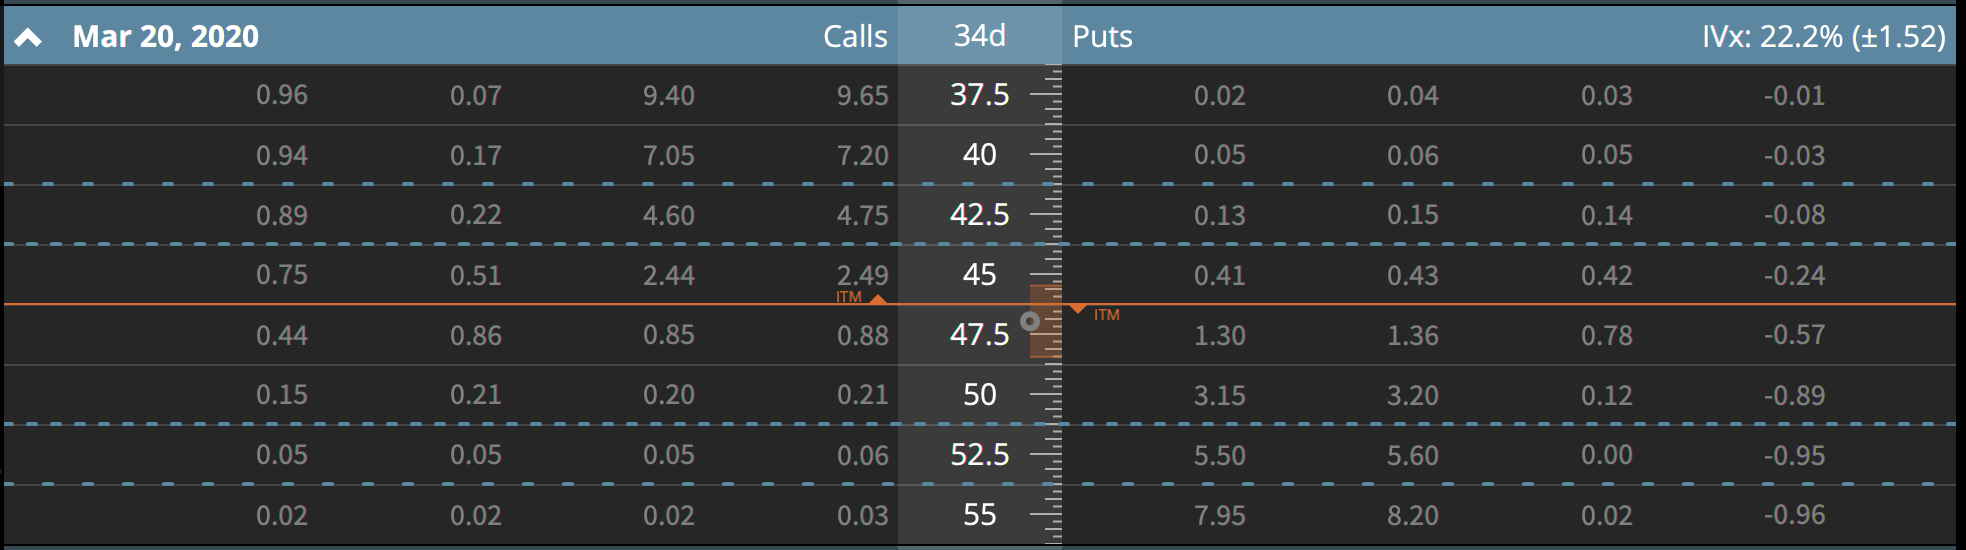
Let’s start with the basics. CSCO today is trading at approx $47 and Tastyworks says that it has an IV Rank of 14.6 as of the close on 2/14/20. This isn’t a stock I would be super interesting in trading right now, and I’ll try to show why and how implied volatility impacts trading for specific stocks. Let’s start with the next month’s option chain.
If you look at the upper right part of this option chain, you’ll see that CSCO has a current implied volatility of 22.2% which mean that it is expected (within one standard deviation) to move up or down approximately $1.52 over the next 34 days. You can see on this picture that CSCO’s current price is highlighted which the orange line and on the ruler in the middle of the screen that expect move is highlighted as well. Basically if you are trading CSCO today you can expect with ~68% probability that it’ll be valued between ~$44.5 and ~$48.5 in 34 days. That isn’t a huge range, which can make it tough to make much money trading it -especially with options that have strike prices wider than the expected move!
If you wanted to do a simple 30 delta strangle you’d basically have to pick the $47.5 (44 delta) or $50 (15 delta) calls and the $45 (-24 delta) puts. For the $47.5/45 strangle, you’d take in about $1.28 in credit and need to put up ~$887 in risk capital. You’d have a 57% chance of profiting, and approx 72% chance of being able to buy your strange back for 50% profit over the next 34 days.
If you happened to pull that off, you’d make approx $61 per contract on a risk basis of $887 or about 7% return on risk capital.
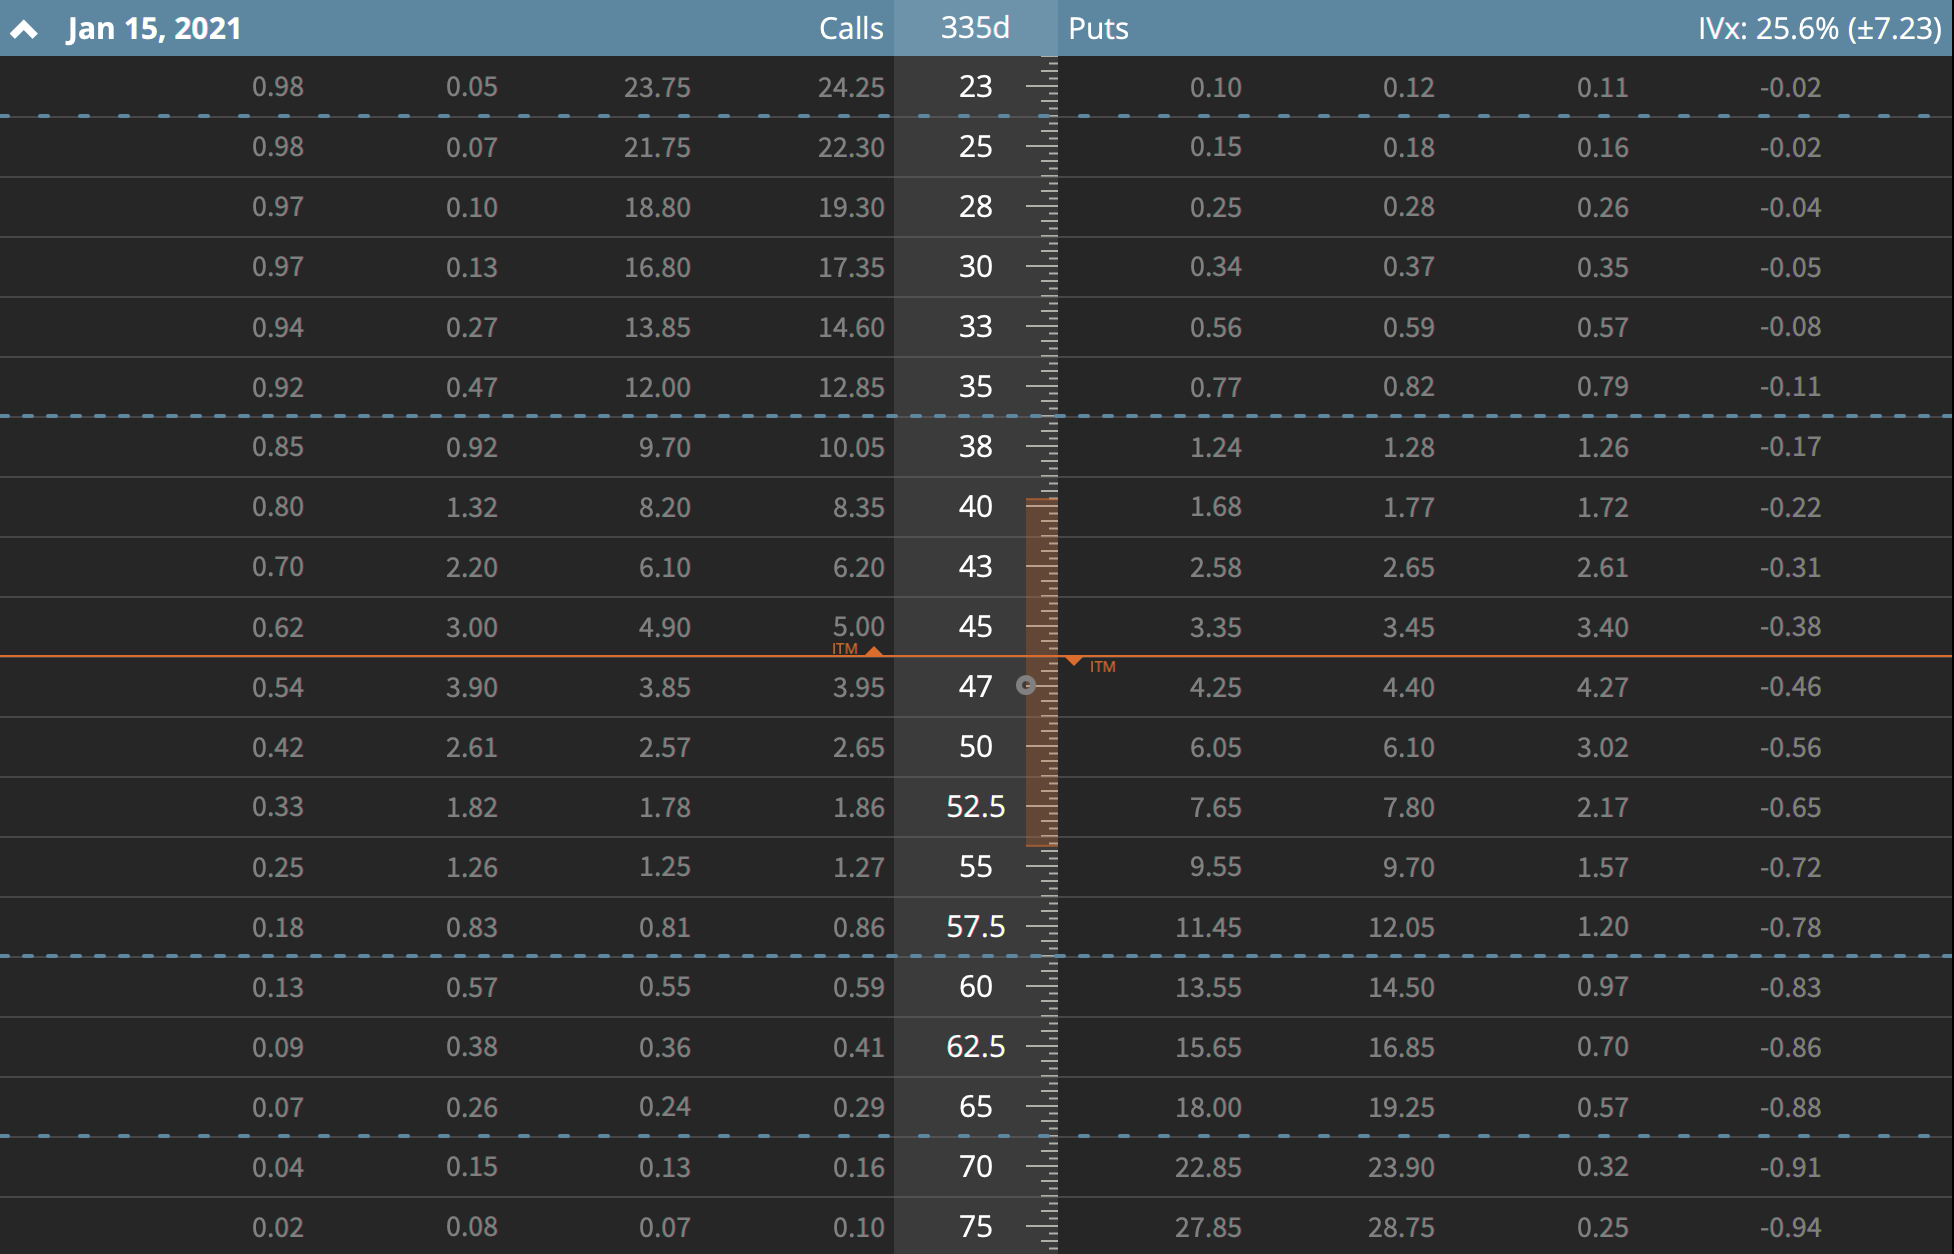
Jumping WAY out into the future you can see the roughly 1 year away option chain on CSCO below. Notice I had to open up a lot more strikes to show the expected move as well as the one and two standard deviation levels (dashed blue lines). Current implied volatility has CSCO expected to move roughly $7.23 in either direction over the next year. If you are crazy bullish, you could expect it to end up around $57.5 at the high end of a normal movement. These expected ranges will change over time; based upon what is happening in the general market as well as for the specific underlying. In something like CSCO, you can expect that roughly once a quarter, implied volatility will come up a bit (right before earnings) and then come back in after earnings. This may provide interesting opportunities for you to trade – as we will look at later.
Okay – so now that we’ve look at a reasonably low IV Rank item; let’s take a look at a high IV Rank stock, MSFT.
As you can see, the IV Rank is 67.5 which is quite a bit higher than CSCO @ 14.6. But why does that matter? (Patience, I’ll get to it!)
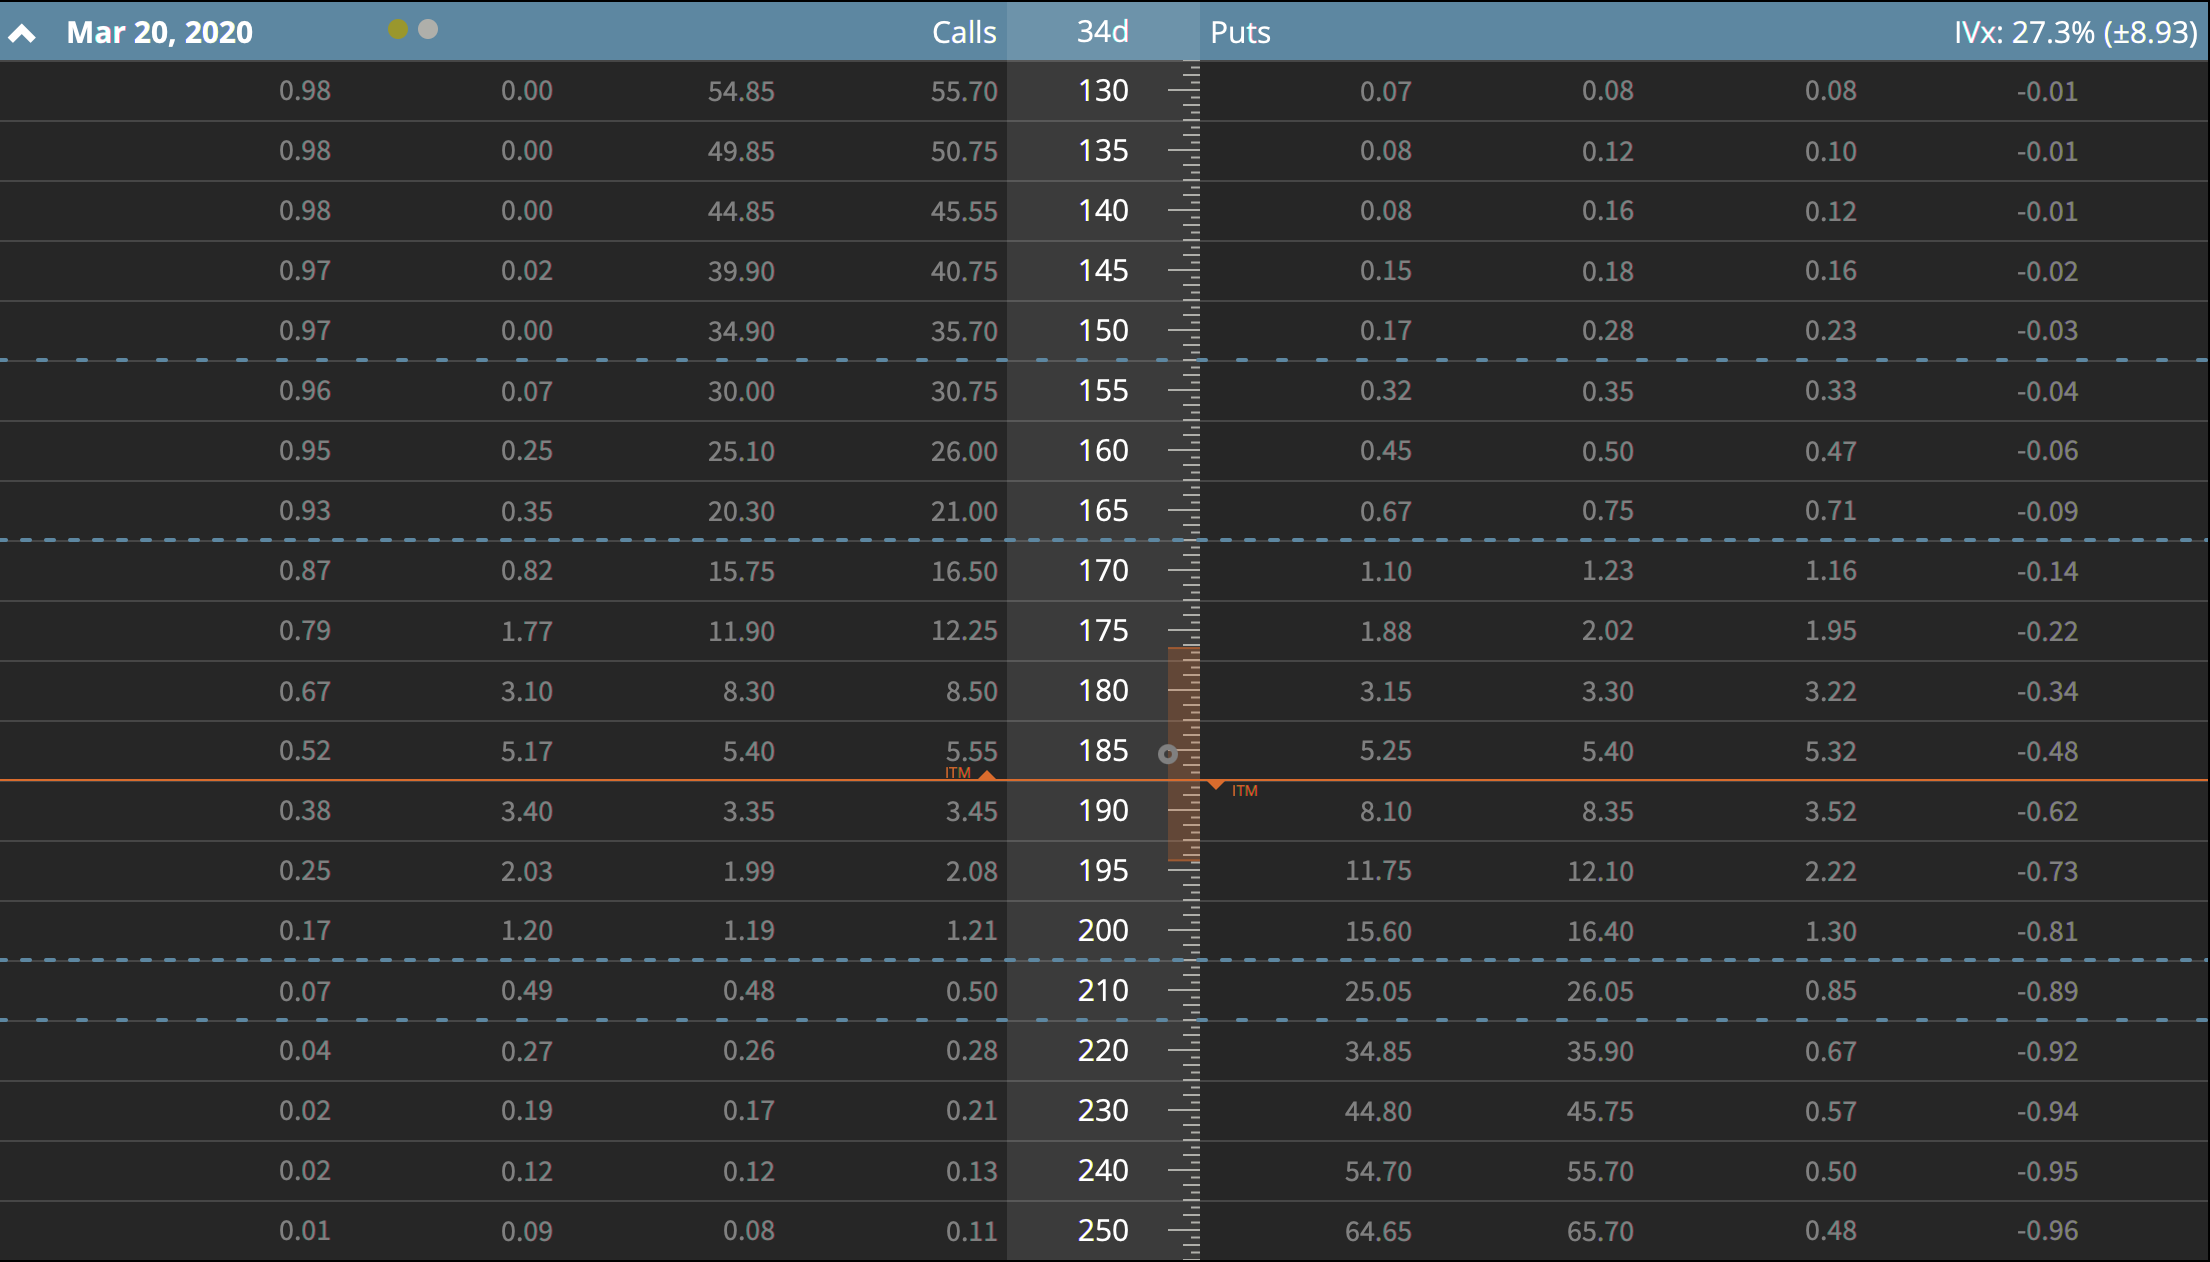
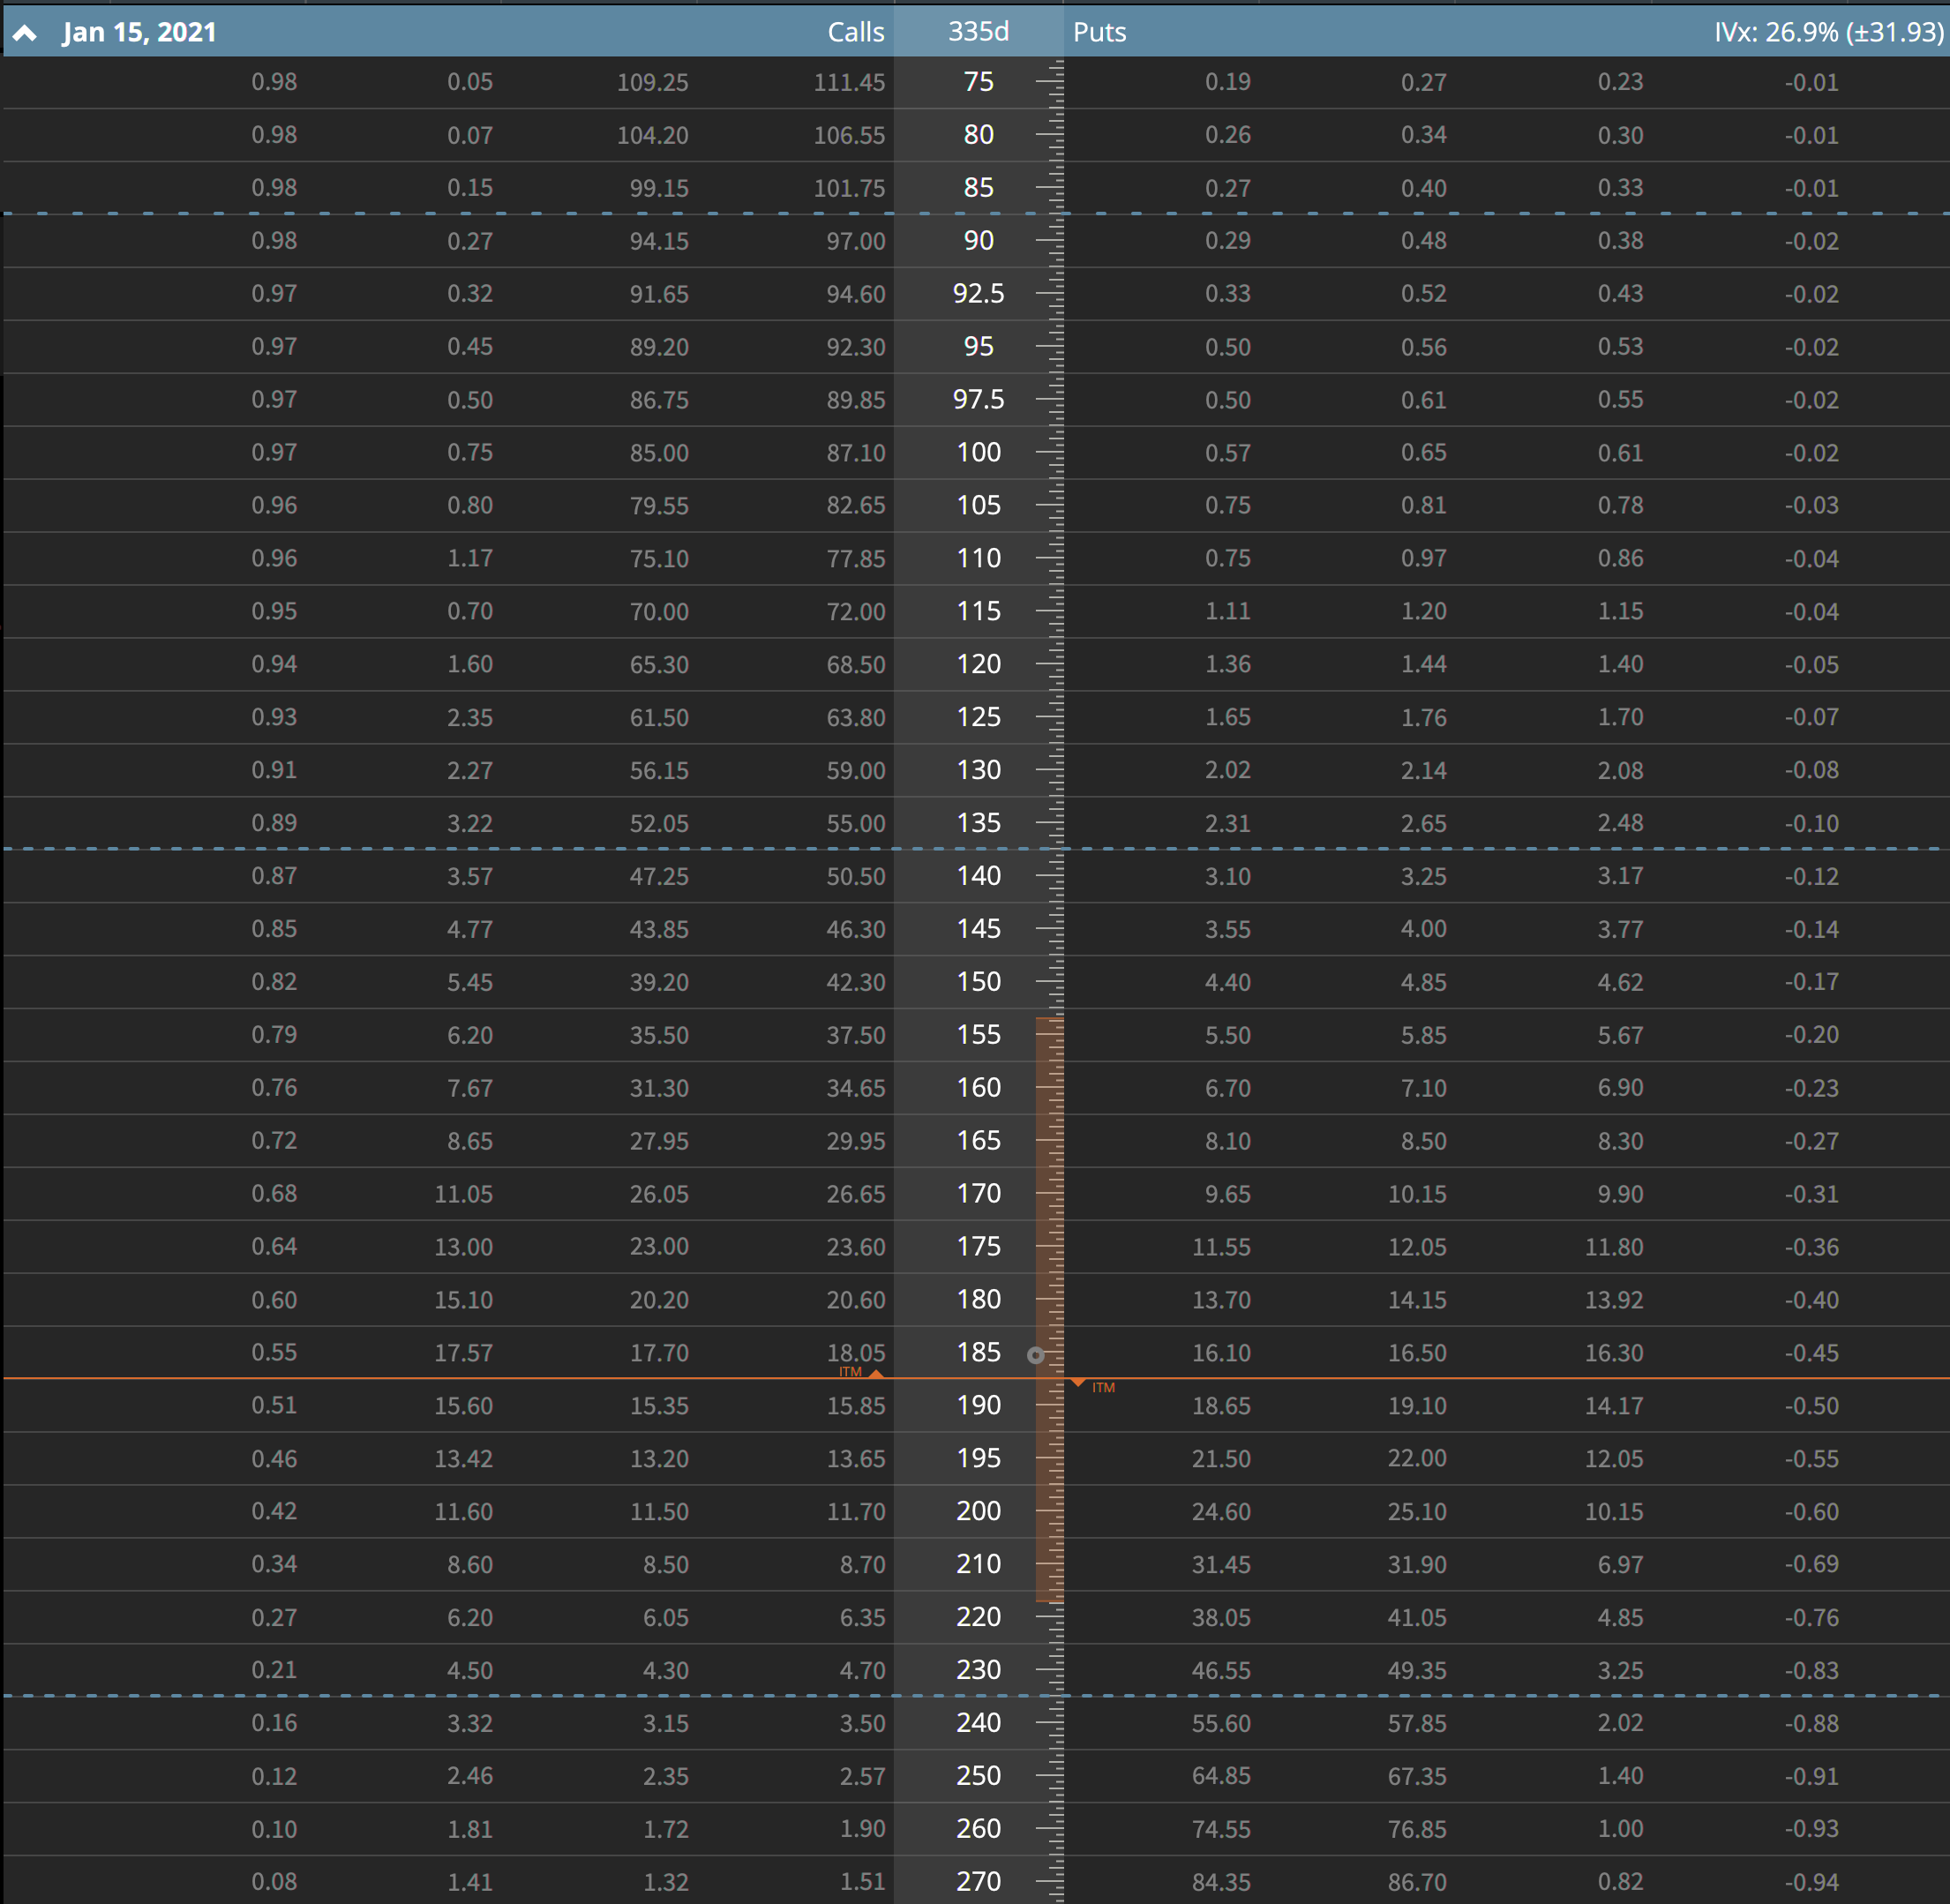
Let’s look at the options table just like we did for CSCO. Here is March, then Jan of next year for MSFT.
Wait a minute! This has an implied volatility of about 27% vs. CSCO at 26% – that’s basically the exact same thing for the next year! Yup.
So looking at MSFT, you see that the implied volatility is about 27%, meaning the expected move is around $9 through the March cycle, and round $32 for the next year. Microsoft is a much higher priced stock at ~$185 so the nominal price moves are greater.
Let’s take quick look at that 30 delta strangle as well. You could sell the $290 call (34 delta) and the $180 put (-34 delta) for about $6.65 in credit and you’d need to put up $3,240 per contract. The probabilities are 55% probability of profit, and 75% probability of being able to sell it for 1/2 the credit. So let’s see what that looks like. 1 contract, let’s say you only got $6.60 for the strangle and bought it back for $3.30. So $330 profit over $3,240 in buying power for a return on risk capital of about 10%. That’s a bit nicer than the CSCO 7%. Crazy huh!
IV Rank
So why on earth would two stocks with basically the same implied volatility have two totally different IV Ranks? I have to go away from Tastyworks for a moment to show you why – and I’ll use my IV Rank tool on TOS.
In a nutshell, IV Rank is the position of the current implied volatility relative to the historical implied volatility for the underlying security. Typically this is over the last year of observed implied volatilities.
Note: My calculations on TOS are not going to be the same as the ones on Tastyworks. The Tastyworks team has done a great job of building a real-time calc that is way more accurate than what I can do in TOS.
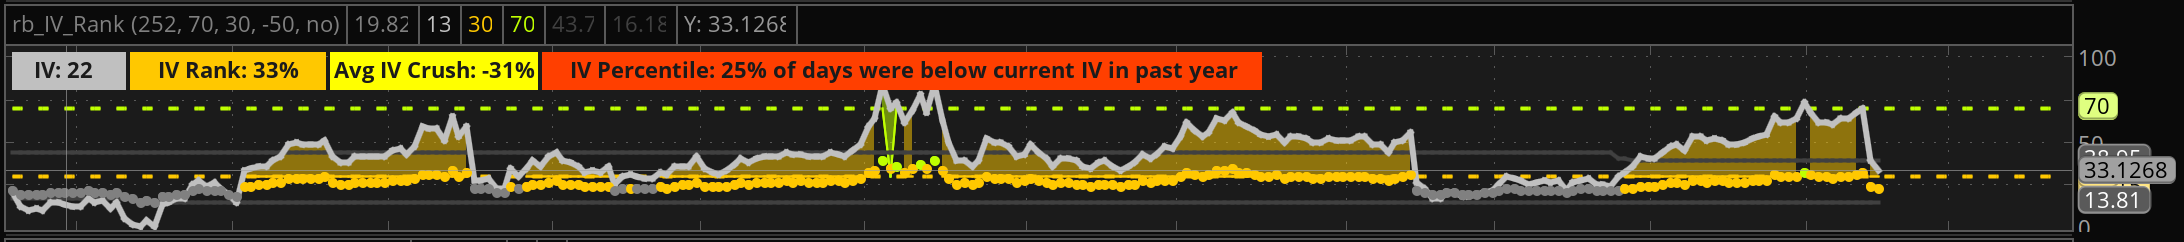
First, let’s take a look at CSCO. This chart is kinda difficult to read, but it shows the general change in implied volatility for CSCO over the last year or so. As you can see, it jumps around a bunch! It’s been as high as about 44% and as low as around 14%.
To make it simple, if you said that the range of CSCO’s implied volatility over the last year was between 14 and 39, or roughly 25 percentage points wide. The current IV is roughly 33% in the range from 14 to 39.
Simple eh? Okay, maybe that didn’t make any sense. Let’s try it slightly differently.
For CSCO, the highest implied volatility observed over the last 12 months was 38.95. The lowest implied volatility was 13.8. That gives us a range of 15.15 percentage points difference between the top and the bottom of the observed implied volatilities.
If we look at the current implied volatility of 22.15 and subtract the lowest observed of 13.8 we get a current implied volatility that is 8.35 percentage points above the lowest observation.
If the range of the highest to lowest observations was 25.15 percentage points wide, the current reading of 22.15 is 33.2% into the range.
Okay – one more time, maybe as a set of variables:
Lowest = 13.8
Highest = 38.95
Current = 22.15
Range = Highest – Lowest = 28.95 – 13.8 = 25.15
Position = Current – Lowest = 22.15 – 13.8 = 8.35
IV Rank = Position / Range = 8.35/25.15 = 33.2%
Makes sense? Good!
Let’s take a look at MSFT.
Oh, that’s interesting. That chart looks a little different. It looks like the implied volatility has climbed a bunch recently relative to the normal ranges for MSFT.
Lowest = 16.91
Highest = 32.56
Current = 27.96
Range = 15.65
Position = 11.05
IV Rank = 70.6%
Why does this matter?
Think about it for a moment. If you are selling premium, and option prices are based upon the intrinsic value, time and volatility (roughly) – then you want to sell when the price of volatility is higher relative to the normal price of volatility for an underlying security.
If you look back and the CSCO chart, you can see why this matters. CSCO just had an earnings event, in fact it was on the 12th of Feb 2020 after the bell. So let’s pretend that I wanted to sell a 30 delta strangle before earnings on CSCO.
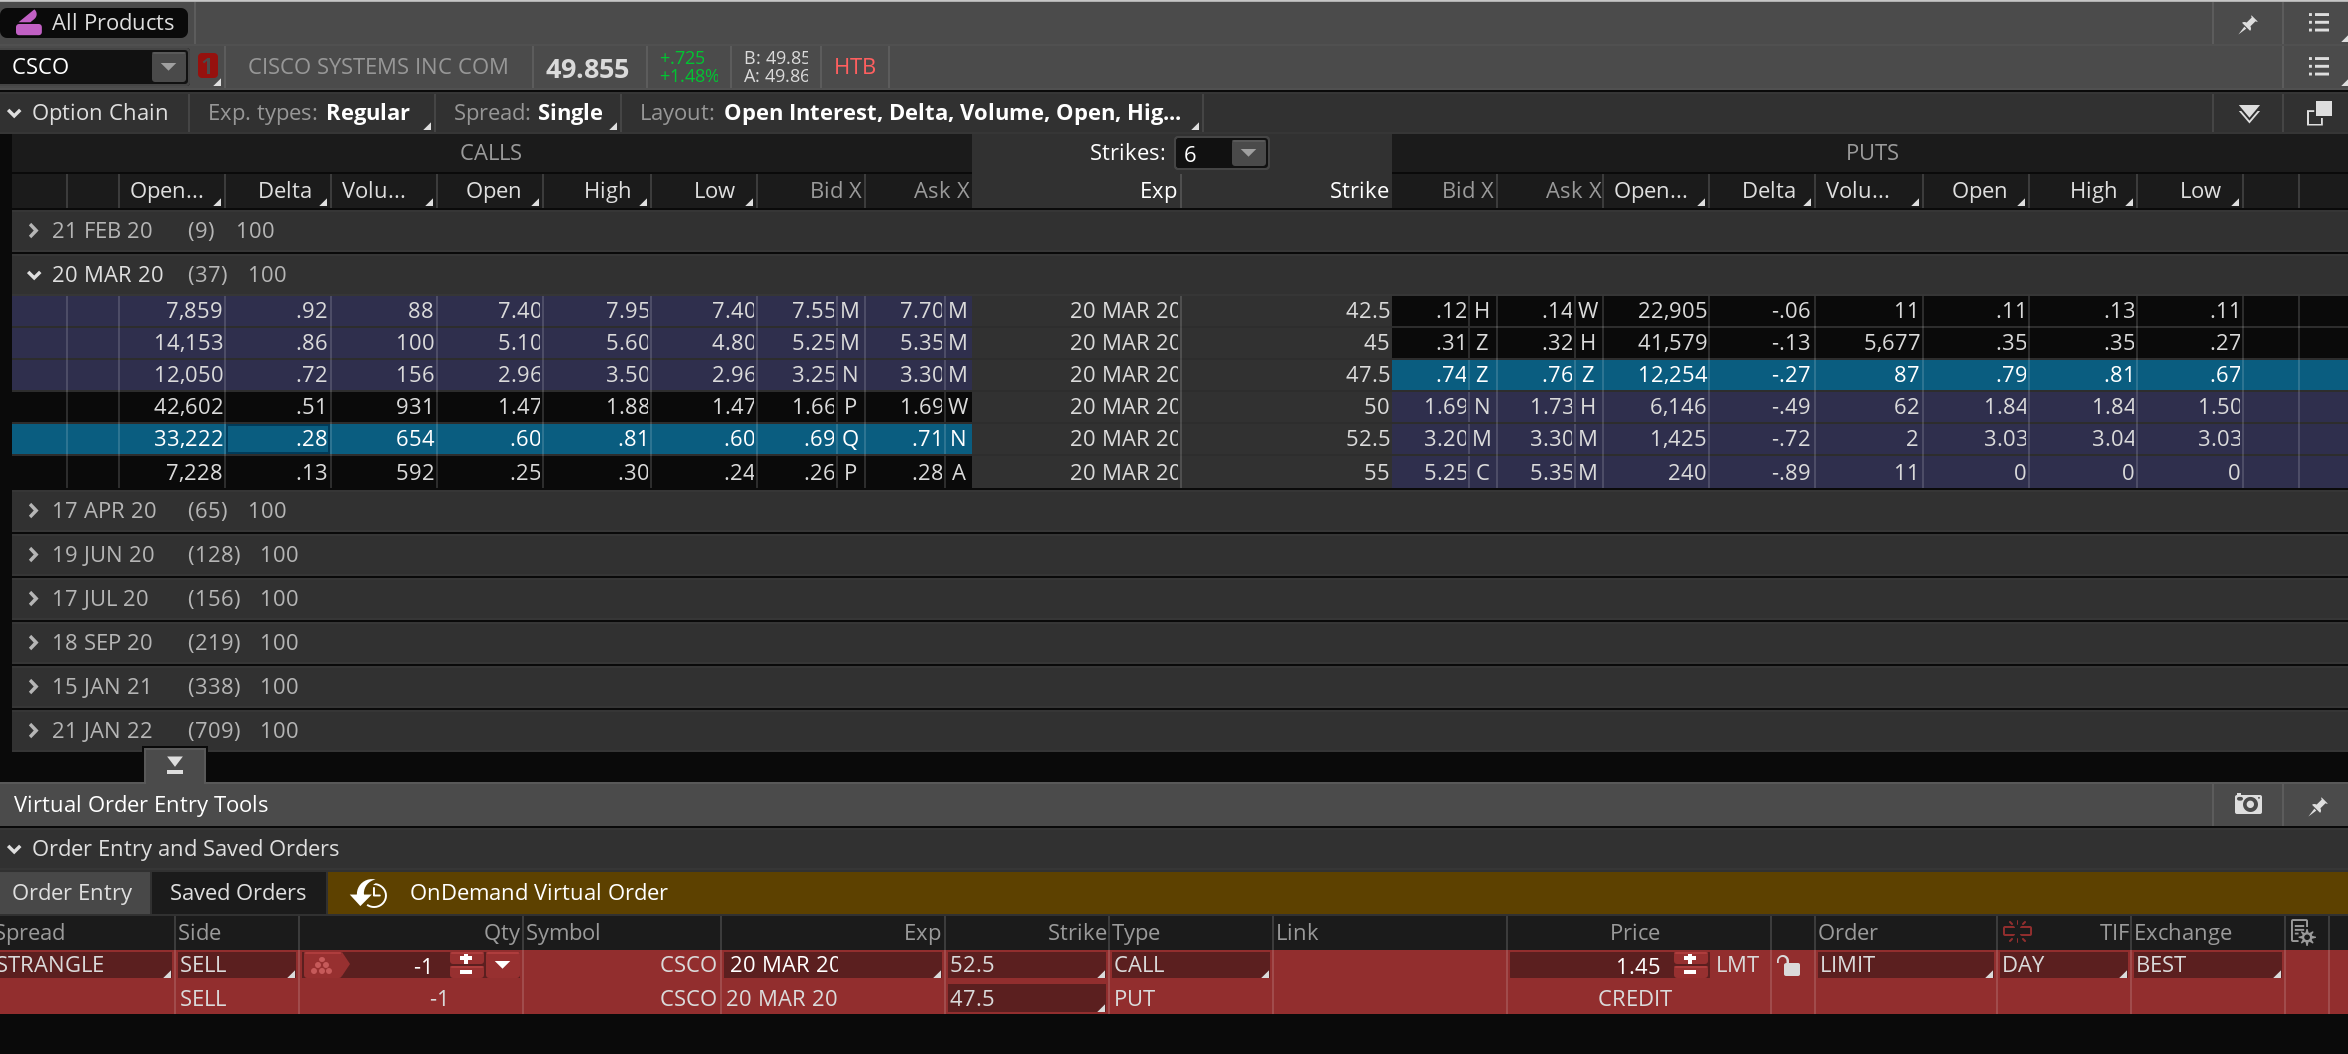
We can use the really cool “OnDemand” feature in Thinkorswim to go and look at the historical pricing for this example. Pretty neat really. This is option pricing for CSCO on 2/12/20 @ 10:45 am EST.
The 30 delta strangle on the 12th would be the 52.5 call and the 47.5 put for a credit of $1.45. Notice that is now a wider strangle (5 points, vs. 2.5 points) and I’m taking in more credit $1.45 vs.$ 1.28 today.
If you had sold the 52.5 call and 47.5 put strangle on the 12th for $1.45, you could have bought it back for $1.38 on the 14th even though your strikes had been breached. The contraction in implied volatility made a loser into a winner. CSCO is currently below your short put, the stock has moved against you by roughly 6% in a day and you still have a 5% winner on your hands.
Let’s go the other way and maybe you just had the brilliant idea that CSCO was going to come done to $47 by Friday. So you decided to simply sell a call spread, how about the 50/52.5 call spread for $0.97; today you could have bought it back for $0.16.
Maybe you prefer Iron Condors, so you sold the 50/52.5 by 47.5/45 for $1.41, you can again buy it back for $1.07 today.
All of this is because implied volatility today relative to implied volatility a few days ago is way lower.
Other than the call spread (which is basically cheating because I know what happened), every one of those non-directional strategies had a move strongly against the position. They are also all profitable.
Please don’t mis read that to think that all earnings trades are profitable. I had a max loser this last week as SHOP blew through expectations. I used a spread, it got smoked and no amount of volatility contraction can fix that.
Wrapping a bow on it
Hopefully this long meandering post about IV Rank is helpful. In a nutshell, IV Rank represents the current implied volatility of an underlying relative to its historical implied volatility. You generally want to sell premium when implied volatility is higher than when it is lower.
Selling premium in low IV Rank underlying’s is extremely difficult as your “edge” as an options trade has all but evaporated.
I’m a huge fan on SoFi. For those of you that haven’t heard of the company, it’s called Social Finance and started out as a student loan refinancing firm for students from specific schools. I don’t know all of the details on how it worked; however I know that I happened to graduate from one of the schools they had funding for and SoFi provided some great student loan options for me while I was paying off those debts.
If you are interested in using SoFi’s services I have a few referral links. Each one of them gives you a nice little bonus when you open an account. Here are my links for SoFi Money, Invest, and Loans.
SoFi offers a range of products, most of which I’ve found to be very good. They also continue to invest in those products and seem to be making them materially better on an ongoing basis.
Sofi Money – this is probably my favorite of the SoFi services. It’s a really unique checking/savings type of account that spans 6 different FDIC insured banks providing 1.5MM of protection on your cash. The account is super liquid, and pays an extremely competitive interest rate vs. major banks. As I write this article it’s 1.6% APY on cash in the account.
The cool thing about Sofi Money is that you can basically ditch your traditional savings accounts and just park your money in this account instead. You of course need the disincline to not just spend it because it’s there! For those of you who are financially responsible, Sofi Money can really help minimize the amount of accounts you have to manage.
Sofi Money isn’t perfect though! I’ve found a few times when keeping my traditional checking account at a major well known bank was super helpful. Sofi Money (as of this writing) doesn’t support wire transfers. So if you happen to re-finance and need to wire money (even to/from a Sofi loan….) you will need a different bank to get that cash moved quickly. They do offer standard ACH, bill pay, debit card, checks etc…
Sofi Invest – if you aren’t a super active trader, but want to participate in the market Sofi Invest is a really great offering. I use most of the Sofi Invest tools for different parts of my investing portfolio management. They offer some really nice, extremely low fee, managed accounts that have solid ETF’s and low cost products. The active investaccount is nice for a moderately active stock trader. You can place basic orders (market, limit etc…) and purchase individual stocks, they also offer a fractional share purchase option which is nice for someone who wants to be an Amazon shareholder but doesn’t have a couple grand sitting around.
Sofi Invest also provides crypto options. If you happen to be interested in bitcoin and the like, it’s a super easy way to participate in that market as a speculator.
I’d be lying to you if I said that most of my investments are at Sofi Invest. I have my large dollar accounts at other firms. My 401(k) is managed through the financial institution my employer has authorized, and my active trading is mostly through Tastyworks and Thinkorswim. I have a few passive investing accounts that money is simply deposited to at Sofi and they have performed quite nicely. I also use these for some investing programs I have in place for my kids.
Like I said earlier, if you are a passive style investor; this is a great place to park your money!
Sofi Lending – if you must take out a loan; you need a great lender. I’ve had wonderful experiences with Sofi Lending. I have used them to bridge funds during construction and refinancing of mortgages; to refinance my student loans and for home mortgages. My experience is that they are very easy to work with, quick to fund, reasonably priced and have competitive rates.
Once you are a “member” of Sofi by using their products, they also offer a bunch of interesting content and meetups to enhance your financial life.
Overall, I’m a huge fan of Sofi and suggest that if you haven’t tried them out you certainly should! I’d love it if you click my referral links: SoFi Money, Invest, and Loans as it works out nicely for both of us. However, if you’d prefer to not do that simply go to http://www.sofi.com and check it out yourself!
Tastyworks has quickly become my go to brokerage. If you are an active options trader, it’s my personal opinion that you are missing out if you aren’t using Tastyworks.
Tastyworks is from the same team that started ThinkOrSwim before TD purchased it. These guys know options inside and out and have built some of the absolute best trading platforms for the retail trader over the years.
If you are interested in using Tastyworks here is my referral link.If you choose to sign up, I get a “credit” on their referral program. Unfortunately other than having a really great broker – there isn’t anything special in it for you 🙂
When you first open it up, tastyworks can be a little difficult to figure out. They don’t offer paper trading or anything like that, so the learning curve can be a little awkward out of the gate – however once you get the hang of it you’ll wonder how you ever traded without this type of a setup!
I’ve used ThinkOrSwim for a long time and as soon as Tastyworks charting gets up to the capabilities I have in TOS, it’s very possible I’ll be closing those accounts down and moving everything to Tastyworks.
So, when it comes to a brokerage – let’s talk brass tacks.
Fees: Tastyworks has been a low price leader for a long time. Tom Sosnoff and Scott Sheridan have been at this active options trading thing for a long time and they understand it. In fact, they offer max commissions for larger lot traders which is basically awesome. All of the details are available on the Tastyworks site: https://tastyworks.com/pricing.
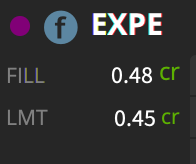
Fills: Well, let’s just say I see price improvement consistently. Here is a quick little example on a spread I put in the market for EXPE last week. I was filled for a $0.03 larger credit than my limit. Fills are quick and the commission structure of $0 fees (for the most part) to close is really awesome.
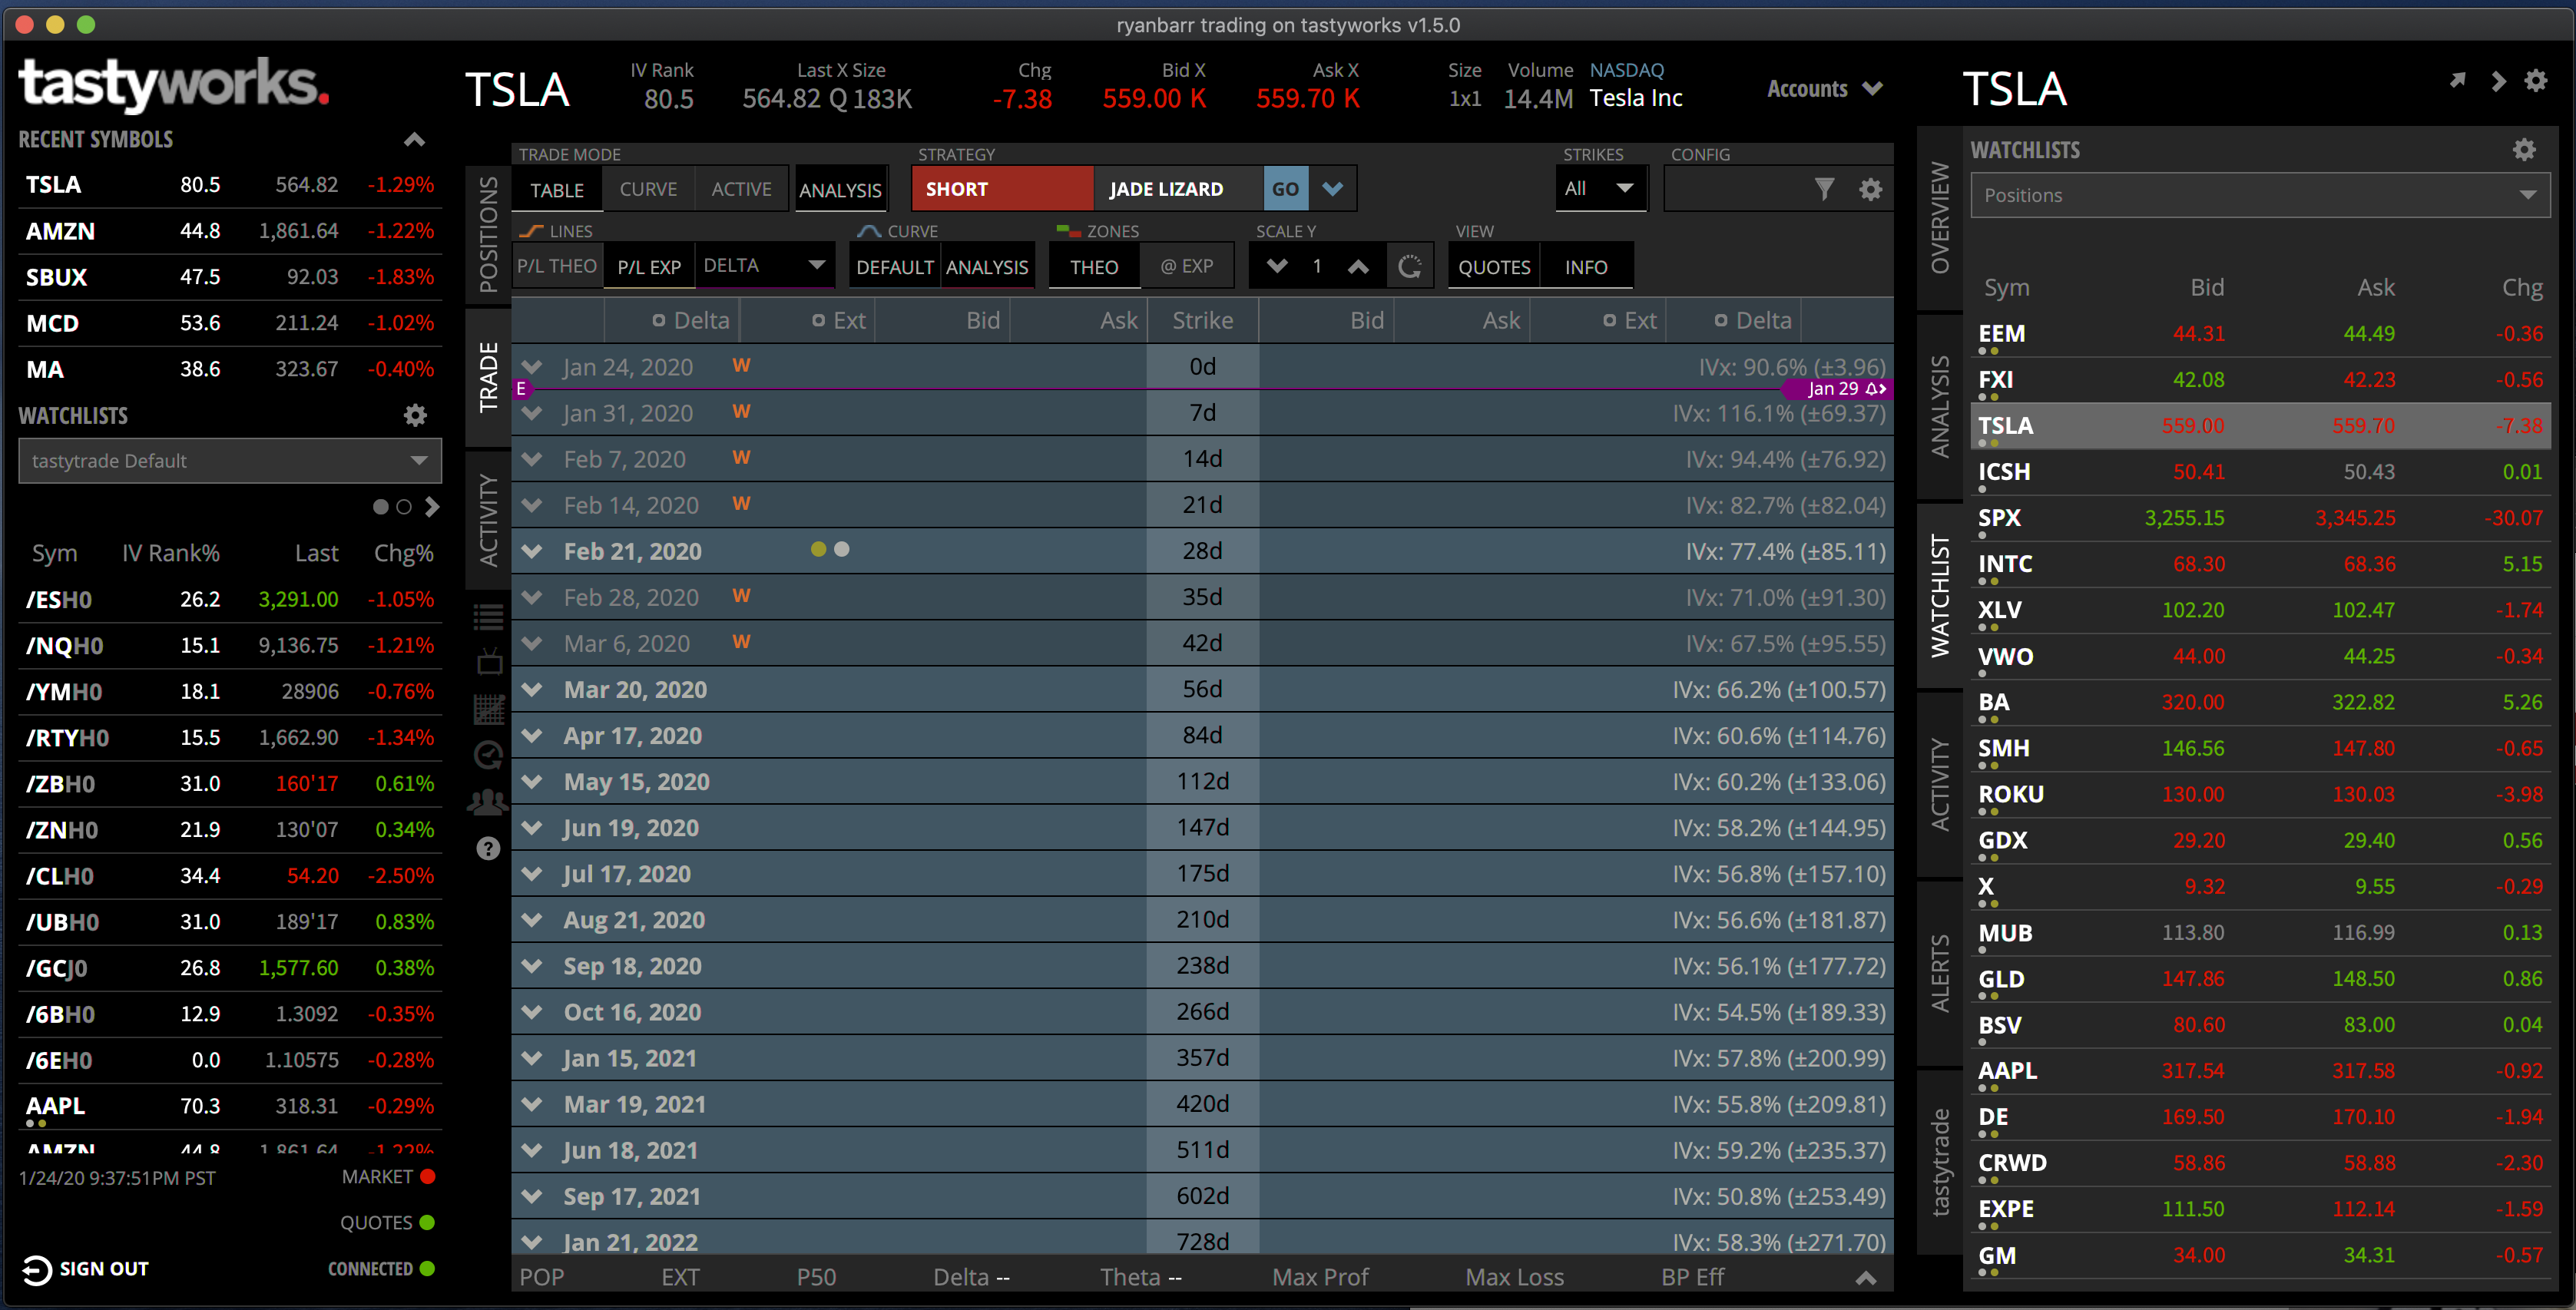
Tech: The platform is really, really good. I’m going to put a couple of screenshots up from my platform. It’s developed for options traders, and it really shines when trading options! It’s kind of awkward for stocks and the active trader setup for futures is only so/so today. I’m confident the team will continue to only improve it!
Tastyworks is really setup to be in 3 “fixed” panes. The pane on the left is your watch lists – it’s always there. The middle “bigger” pane is where the action is, and the right side is where you have lots of options for analysis, activity and all the good stuff.
That middle panel is where things get fun! (I’m not actually going to do this trade, it’s an awful example but easy to show why the platform is so cool)
By simply clicking on the Jan 31 2020 weekly option chain, the chain just opens up.
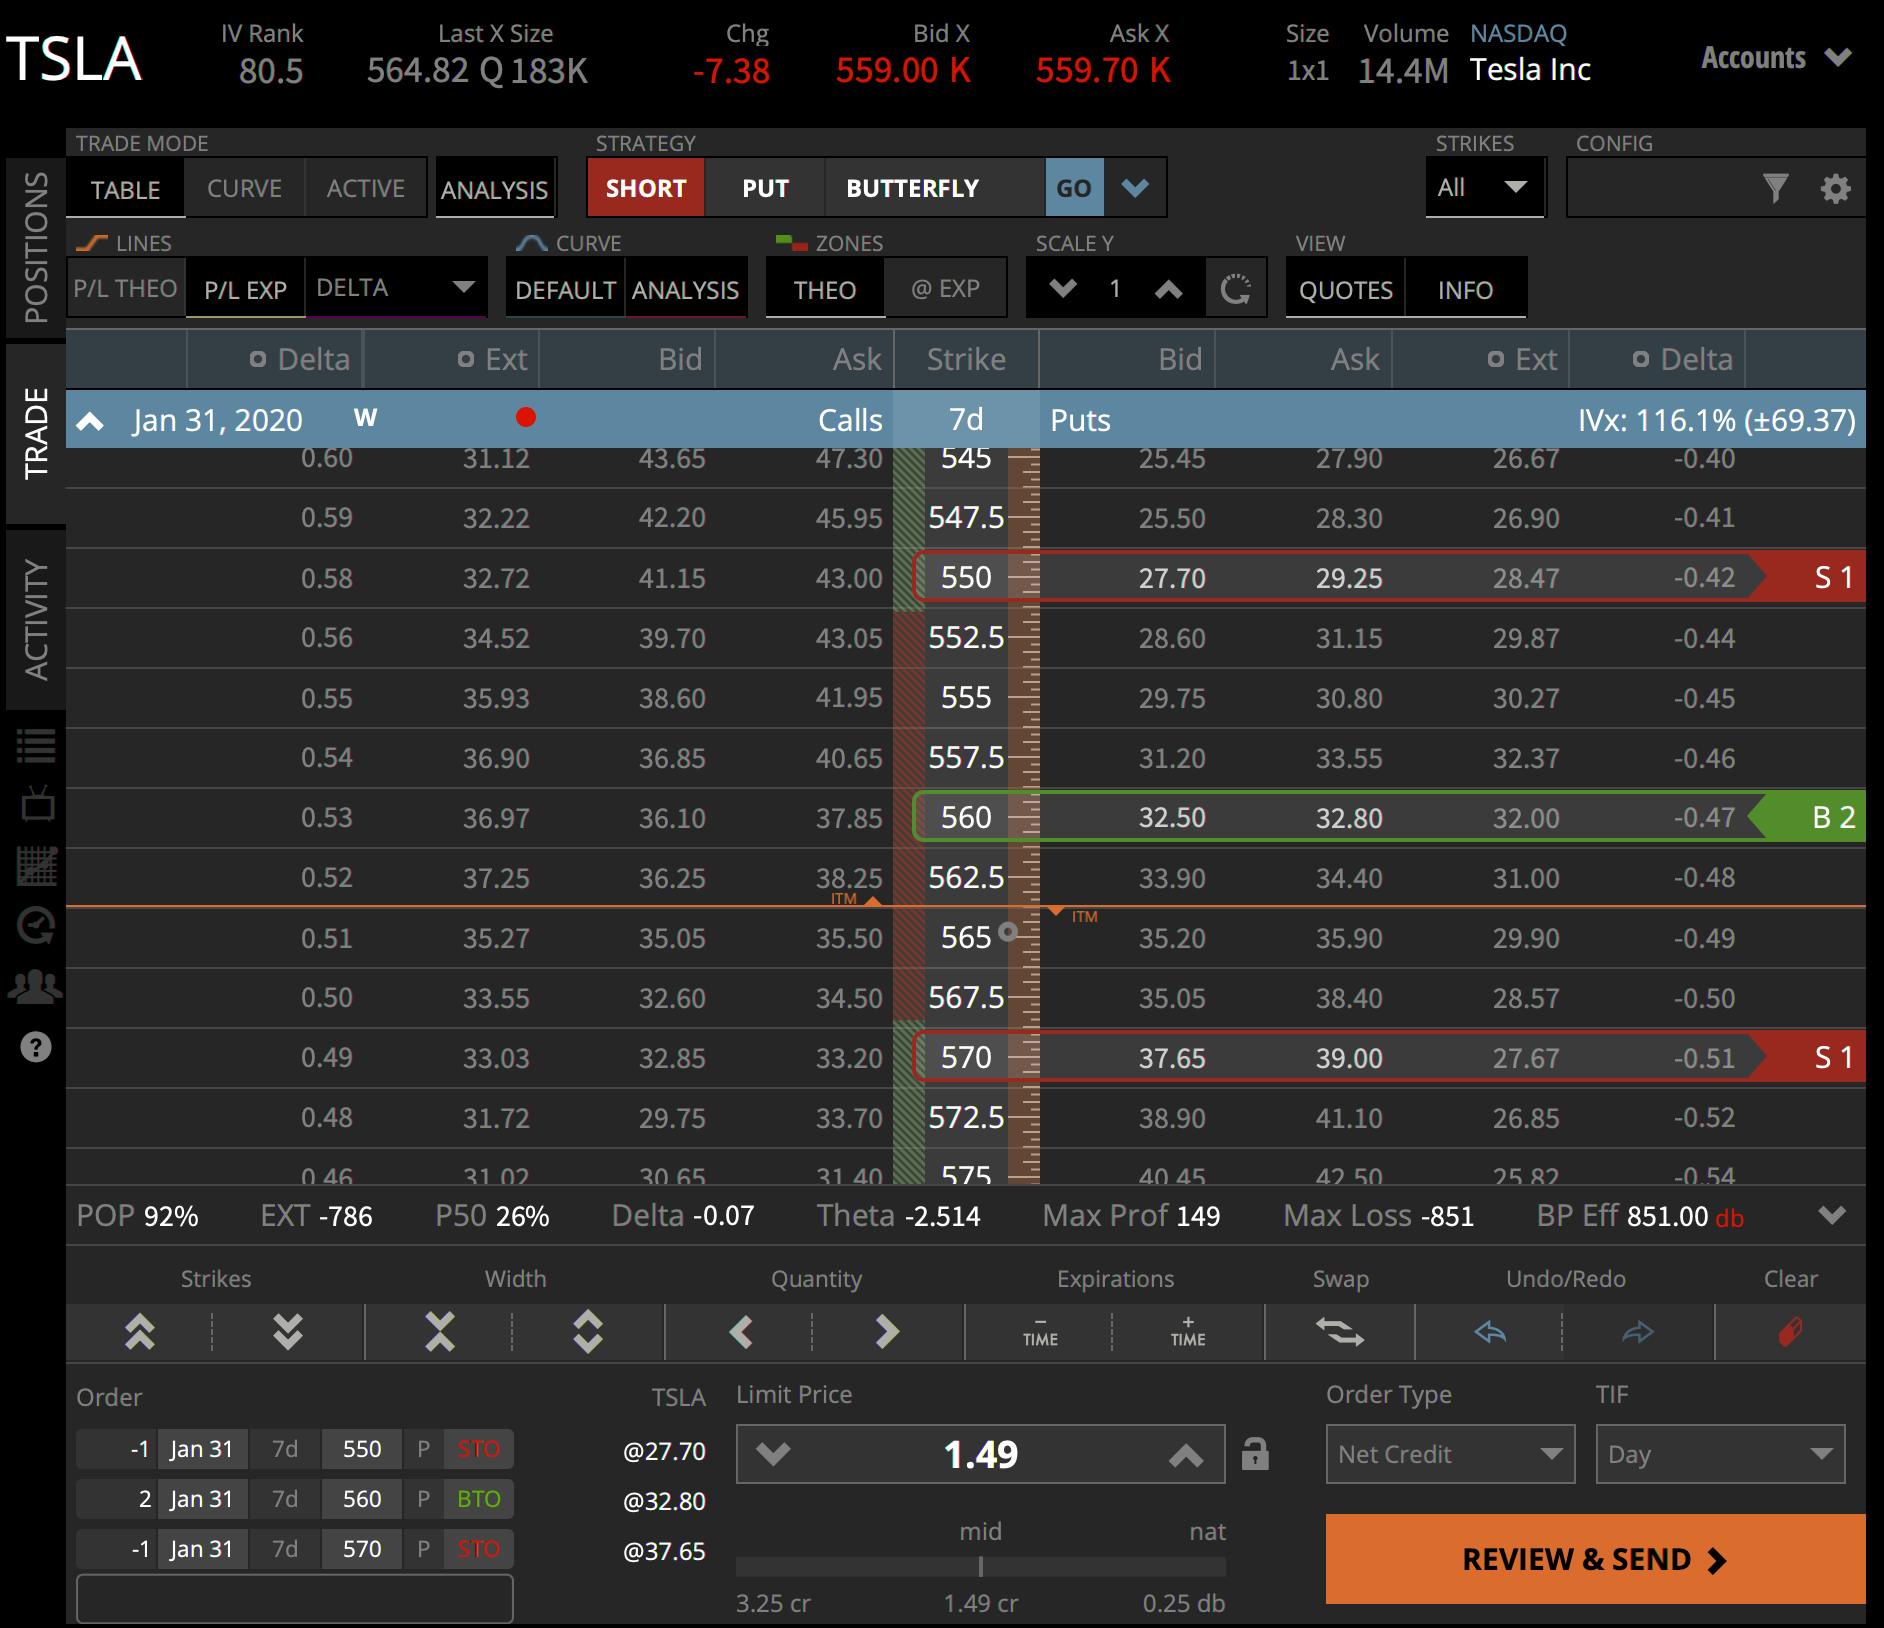
Then you can ether really simply just click on the bid and asks to put up a spread or complex position, or use the little “strategy selector” to put on a trade. The legs can be dragged and dropped and it’s super intuitive.
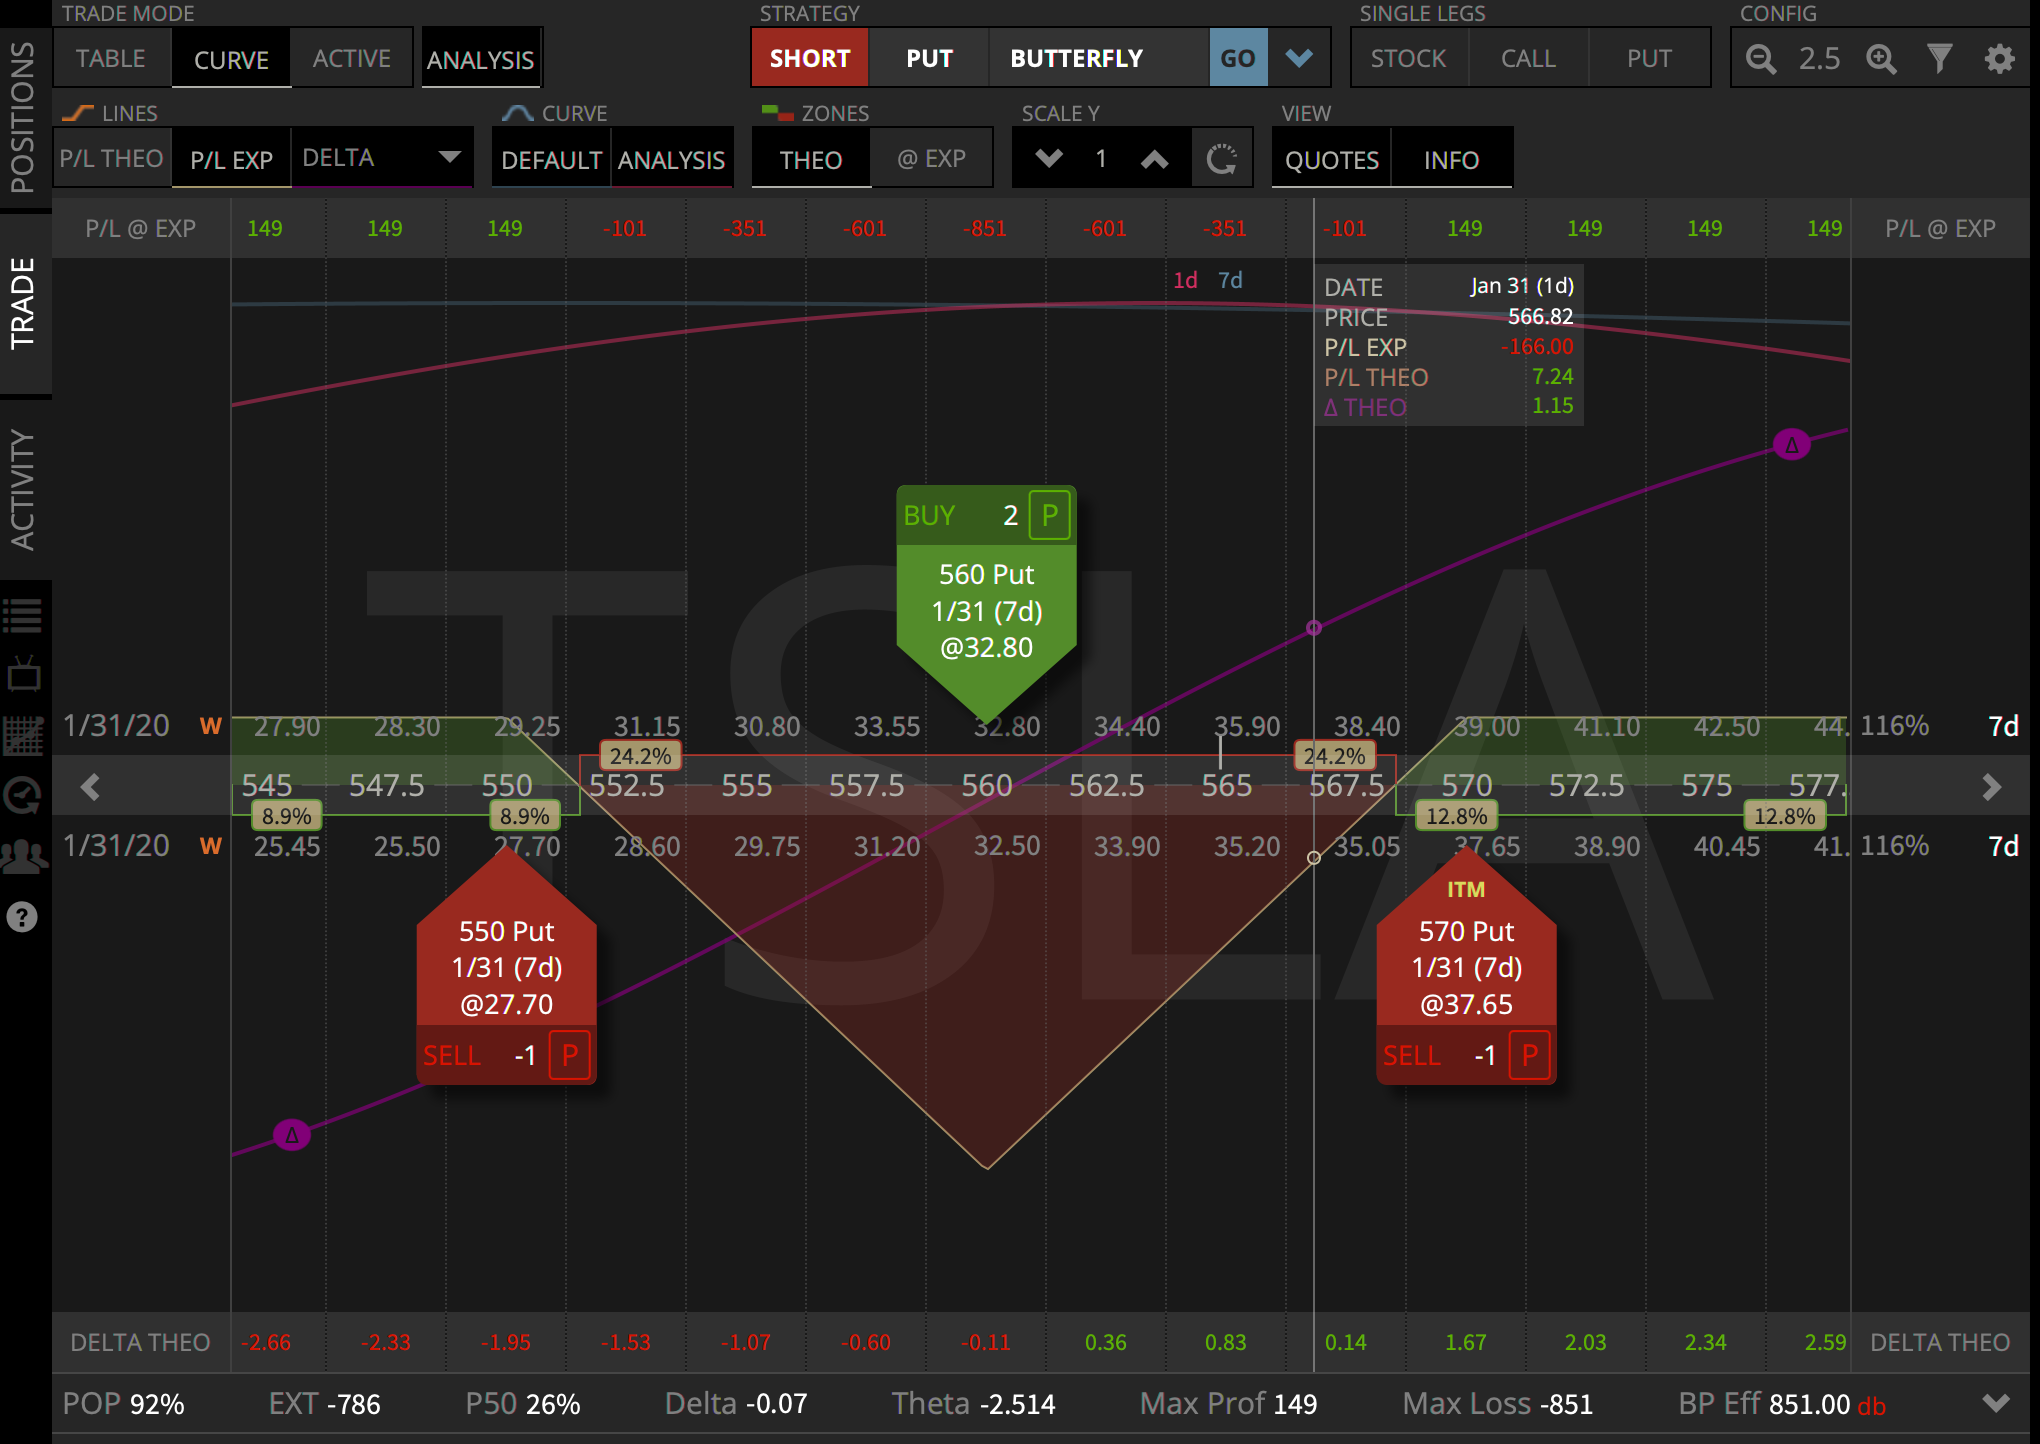
If you want to see what the risk looks like, then just click the “curve” button up top and then you see something like this.
I love this view! (I hate trading from it, but love to look at) This butterfly makes money if TSLA flies off the handle in either direction after earnings. Looking at the chart it’s totally obvious that it makes some money below ~552.5 and above ~567.5, you start to loose a bunch more as you come closer to the long puts at 560. I’ve got a bunch of extra lines turned on to show profit potential and delta positions over time – it’s crazy powerful!
I’ll likely do some more posts on how to trade with Tastyworks over time. Needless to say – I’m a huge fan and can’t recommend it enough. If you don’t have a great brokerage – Sign up with Tastyworks from my link. If you don’t want to use that link – no problem – go to http://www.tastyworks.com and simply check it out!
You Need a Budget, better known as YNAB is my family’s go to budget application. My wife and I use YNAB for all of our daily spend management and basic management of financial events.
If you don’t have a budget today, I cannot stress enough the importance of having one. It is one of the most basic and fundamental things that you need for your financial well being.
If you are interested in using YNAB here is my referral link. If you choose to sign up, you will get a free month, and so do I. It’s $60 a year if you pay annually and in my opinion worth every penny of it.
My wife and I have lived on a budget for the better part of the last decade. We’ve done the cash only envelope method, we’ve done the Excel method, we’ve tried other tools and finally landed on YNAB and the great system that it uses for budgeting.
My experience with a budget tells me one this – it’ll change. The ability to response quickly is the massive strength of YNAB – you have total flexility and control.
In the corporate world, we typically set annual budgets and work to achieve them throughout the year. While we typically don’t change the budget, we almost always adapt during the year based upon changes in our business. At home – the exact same thing happens… unfortunately I don’t have a finance department to help me out in managing all the risks/opportunities, gaps to plan, year to date and year-to-go math 🙂
YNAB does all that without needing an MBA or finance degree and makes it super simple to track what you actually have, and where you plan to use it. YNAB isn’t a wonderful planning tool – it is a wonderful manage what you have and live within your means tool.
The whole principal of the thing is that you budget what you have in the bank. You don’t budget what you think you will get. This is a simple transition for those that have been working with envelopes and cash, but a total mind blown moment for those that have never thought this way.
To get started, you simple put in your actual balances from your bank accounts and credit cards. You can link them and pull transactions if you’d like – personally that’s how I do it.
Once you’ve got your actual cash and debt loaded into the tool you budget what is left over and actually available. You have to make a choice – are you going to carry credit card float (ie: pay less that the statement balance)? Or, are you going to get your finance house in order and pay those things off ASAP.
When you budget what you have, you very quickly find out where your money has been going that you didn’t realize. It’s funny to me how much we spend when we aren’t watching where it really is going….
Ultimately with YNAB, you should find yourself getting to at least one month in advance for your budget. For our house, we have a bunch of “sinking funds” that carry balances for major purchases or emergency funds or what not. When I get paid each month, the cash that hits my bank account goes into the next months budget.
That means, that at the start of every month all of the dollars we plan to spend that month are already sitting in our bank accounts. We may purchase on a credit card and then pay it off, but the cash is in the bank. This method of managing allows you to neatly plan for any type of event: Christmas (put aside some money each month), for a new car, vacation, home improvement project – whatever! When you budget those dollars into the month, you start to build up balances over time that can be used when needed and planned.
YNAB claims that “On average, new budgeters save $600 by month two and more than $6,000 their first year” and I believe it. Having visibility to our spending has helped my family tremendously, and I’ve helped many friends and family get setup on YNAB with great results!
Anyhow – I can’t recommend it enough. If you don’t have a budget – YOU NEED A BUDGET!So why not get started today and here is my referral link. If you don’t want to use that link – no problem – go to http://youneedabudget.com and simply check it out!
I’m going to do a few posts on tools that I use on a daily basis for different financial parts of our life. I’ll talk about why I like them, and why you may be interested in using them as well. Before you decide – I’d strongly suggest you do your own due diligence.
I’ll include a referral link for each of these and make it clear how we both may benefit if you use my referral link. If you choose not to use my link, no problem at all.
My current plan is to have the series focus on the following 4 tools:
YNAB – a great budgeting tool
Sofi Money – a great checking/savings hybrid account
Sofi Invest – passive low/no-fee and active stock management
Tastyworks – one of the main trading platforms I use; amazing for options trading
Each of these are tools that I use just about every day in my personal finances and trading. These tools are likely not for everyone; so please don’t just take my word for it.
If you happen to stumble across this series and have a great financial planning tool suggestion, I’d love to hear it. I use a host of different ones on and off again, however I’ve not yet found one I truly find “sticky” for me… other than Excel.
Anyhow – I’ll get started on these posts over the next few days and hope to have all of them posted by the end of this month.