Having recently started back up the blog, I haven’t been super sure of what content would be useful and attract interest. Over the past couple of weeks, I dropped in some google plug-ins to see what search traffic was bringing visitors and one of the top phrases was “Tastyworks IV Rank”
So, let’s run with that and do a quick breakdown on IV Rank and why it is so crazy important!
IV Rank represents the current implied volatility of an underlying relative to its historical implied volatility
For those of you that aren’t into all of the math that makes up the pricing of options, discussions around all of these concepts likely makes you head spin. So I’m going to do my best to simplify what is all is, and why it is so critically important to your trading.
Volitility
Let’s start with what on earth is volatility in terms of stock and options trading. Volatility, or rather implied volatility, is the expected movement of an underlying over a period of time. This is usually captured by the options pricing markets and can be seen for the “general” market using the ticker VIX. Each underlying has its own specific implied volatility which can be seen using a good tool like Tastyworks or Thinkorswim.
Implied volatility basically says that a particular stock is expected to move up or down a particular amount over a specific amount of time.
I’ve over simplified this a bit so for those of you that are experts – specifically this is in relationship to an annualized one standard deviation move in percentage terms in the underlying as expressed by options pricing.
Here are a few examples from the Tastyworks platform starting with a reasonably low “IV Rank” (we’ll get to that later) stock that you’ve likely heard about, CSCO.

Let’s start with the basics. CSCO today is trading at approx $47 and Tastyworks says that it has an IV Rank of 14.6 as of the close on 2/14/20. This isn’t a stock I would be super interesting in trading right now, and I’ll try to show why and how implied volatility impacts trading for specific stocks. Let’s start with the next month’s option chain.
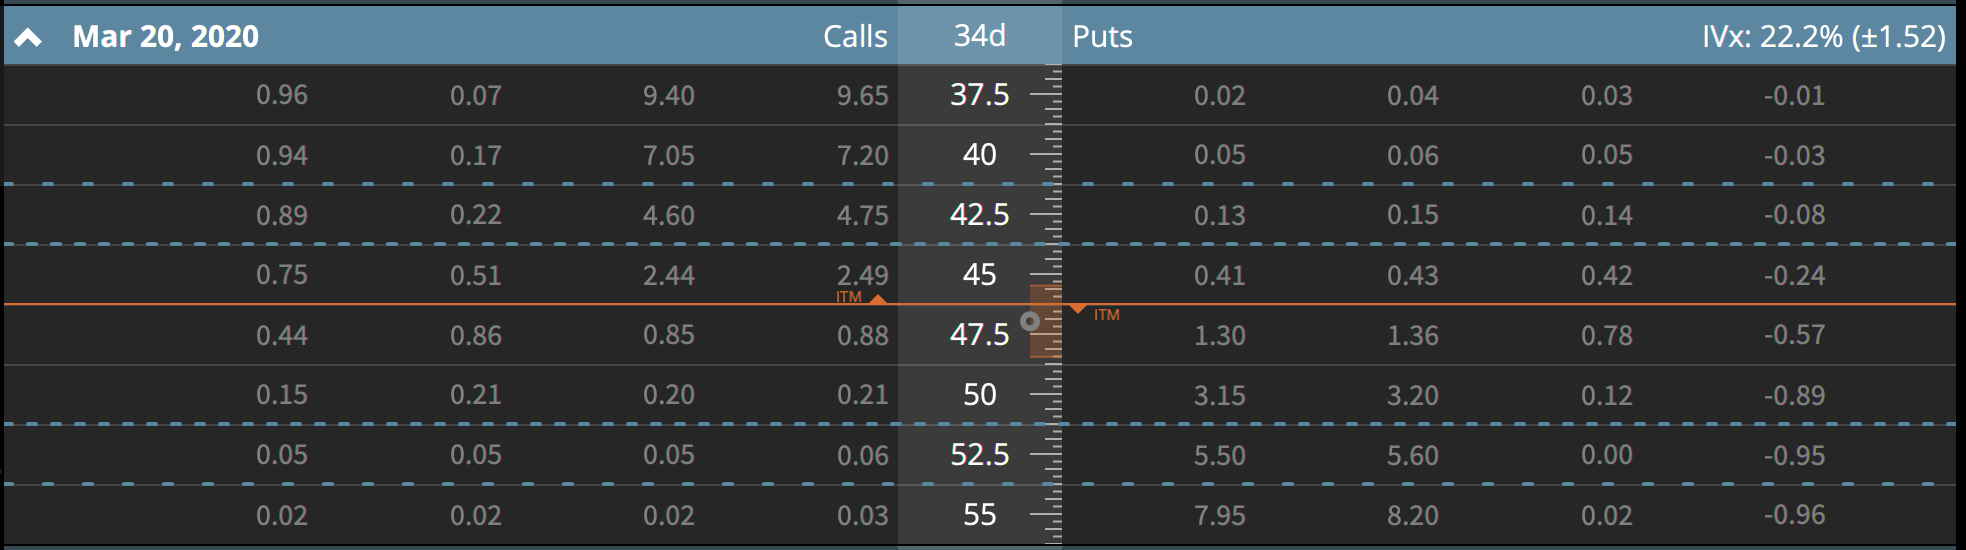
If you look at the upper right part of this option chain, you’ll see that CSCO has a current implied volatility of 22.2% which mean that it is expected (within one standard deviation) to move up or down approximately $1.52 over the next 34 days. You can see on this picture that CSCO’s current price is highlighted which the orange line and on the ruler in the middle of the screen that expect move is highlighted as well. Basically if you are trading CSCO today you can expect with ~68% probability that it’ll be valued between ~$44.5 and ~$48.5 in 34 days. That isn’t a huge range, which can make it tough to make much money trading it -especially with options that have strike prices wider than the expected move!
If you wanted to do a simple 30 delta strangle you’d basically have to pick the $47.5 (44 delta) or $50 (15 delta) calls and the $45 (-24 delta) puts. For the $47.5/45 strangle, you’d take in about $1.28 in credit and need to put up ~$887 in risk capital. You’d have a 57% chance of profiting, and approx 72% chance of being able to buy your strange back for 50% profit over the next 34 days.
If you happened to pull that off, you’d make approx $61 per contract on a risk basis of $887 or about 7% return on risk capital.
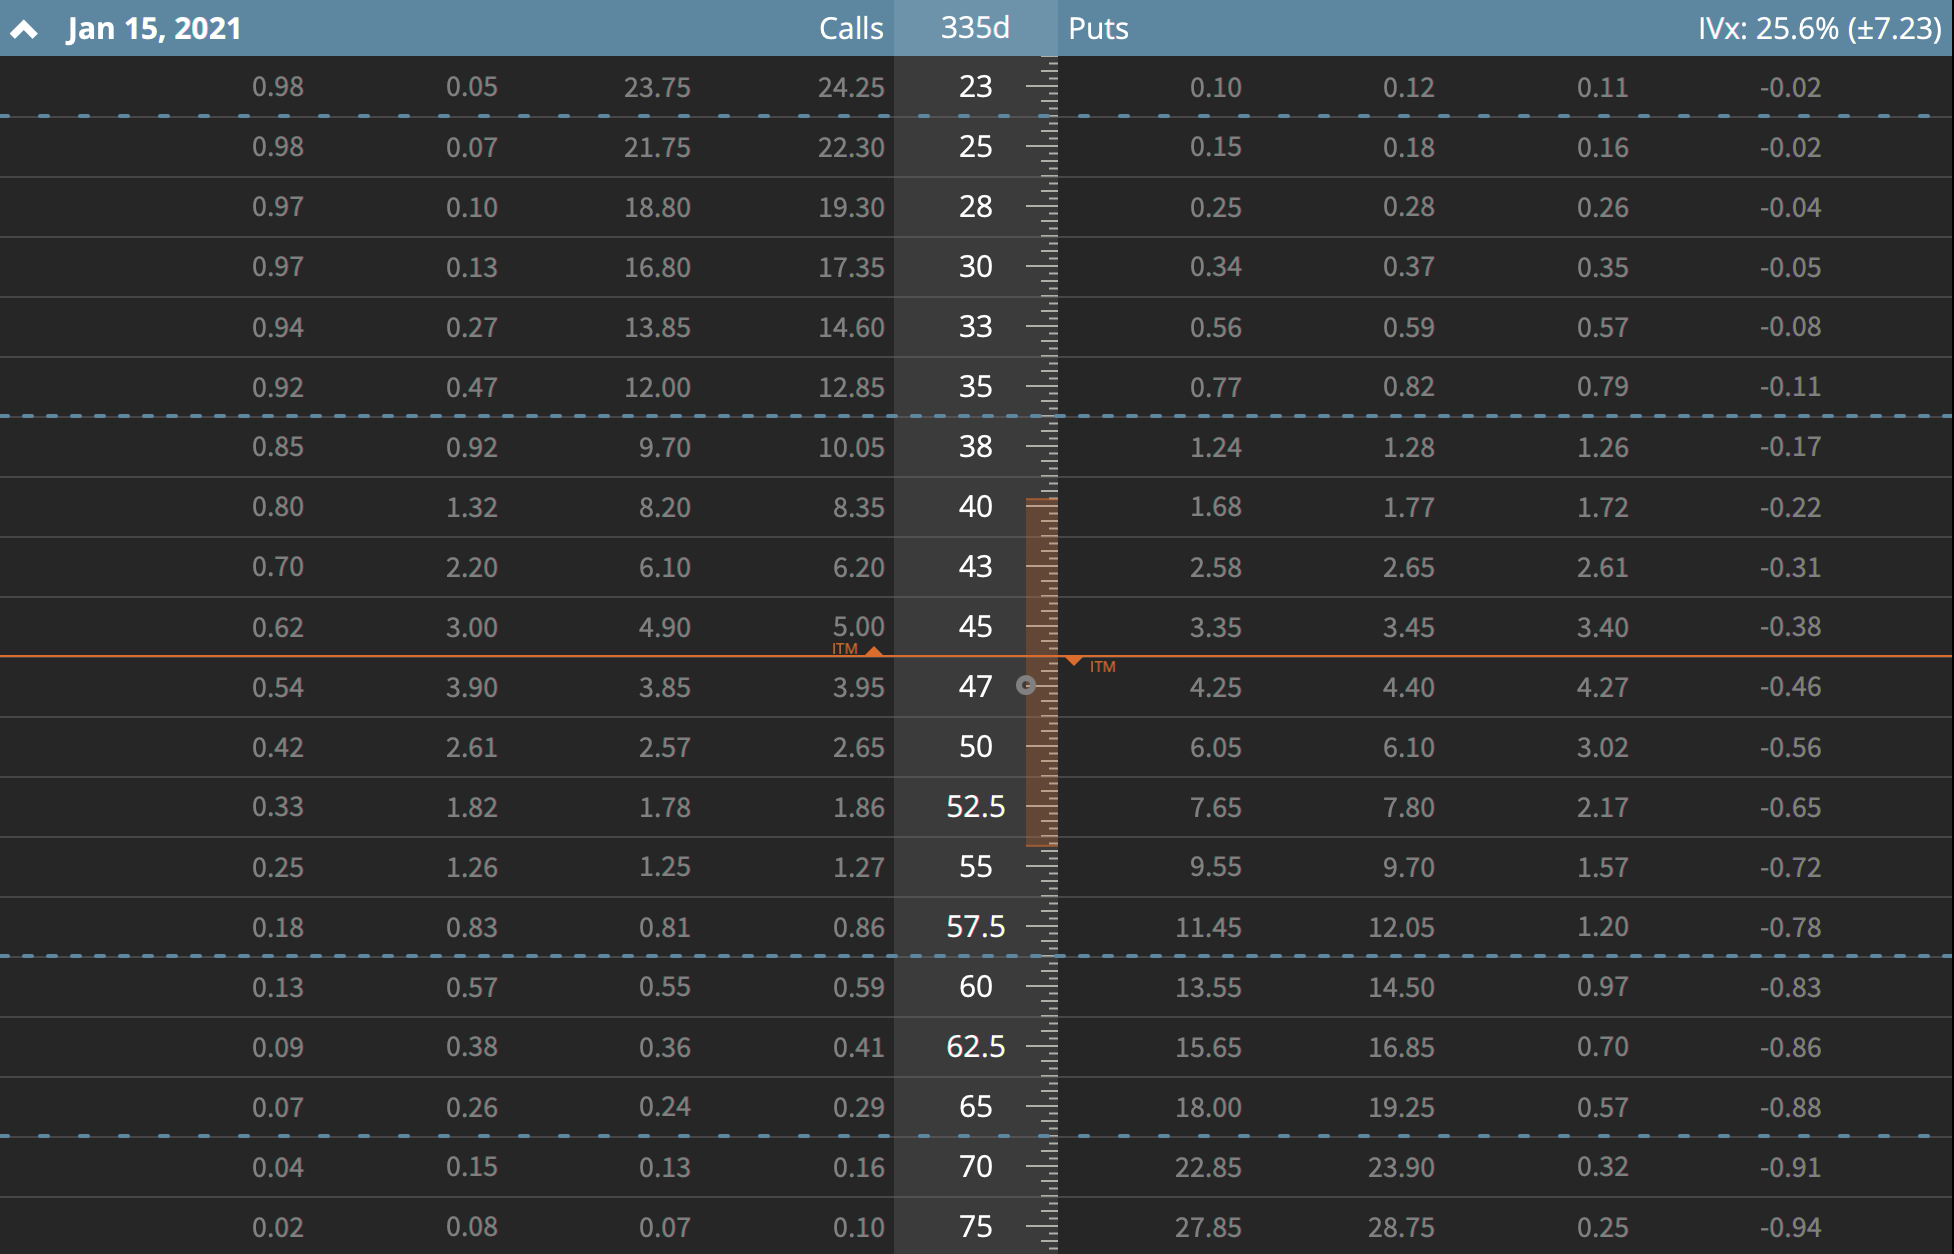
Jumping WAY out into the future you can see the roughly 1 year away option chain on CSCO below. Notice I had to open up a lot more strikes to show the expected move as well as the one and two standard deviation levels (dashed blue lines). Current implied volatility has CSCO expected to move roughly $7.23 in either direction over the next year. If you are crazy bullish, you could expect it to end up around $57.5 at the high end of a normal movement. These expected ranges will change over time; based upon what is happening in the general market as well as for the specific underlying. In something like CSCO, you can expect that roughly once a quarter, implied volatility will come up a bit (right before earnings) and then come back in after earnings. This may provide interesting opportunities for you to trade – as we will look at later.
Okay – so now that we’ve look at a reasonably low IV Rank item; let’s take a look at a high IV Rank stock, MSFT.

As you can see, the IV Rank is 67.5 which is quite a bit higher than CSCO @ 14.6. But why does that matter? (Patience, I’ll get to it!)
Let’s look at the options table just like we did for CSCO. Here is March, then Jan of next year for MSFT.
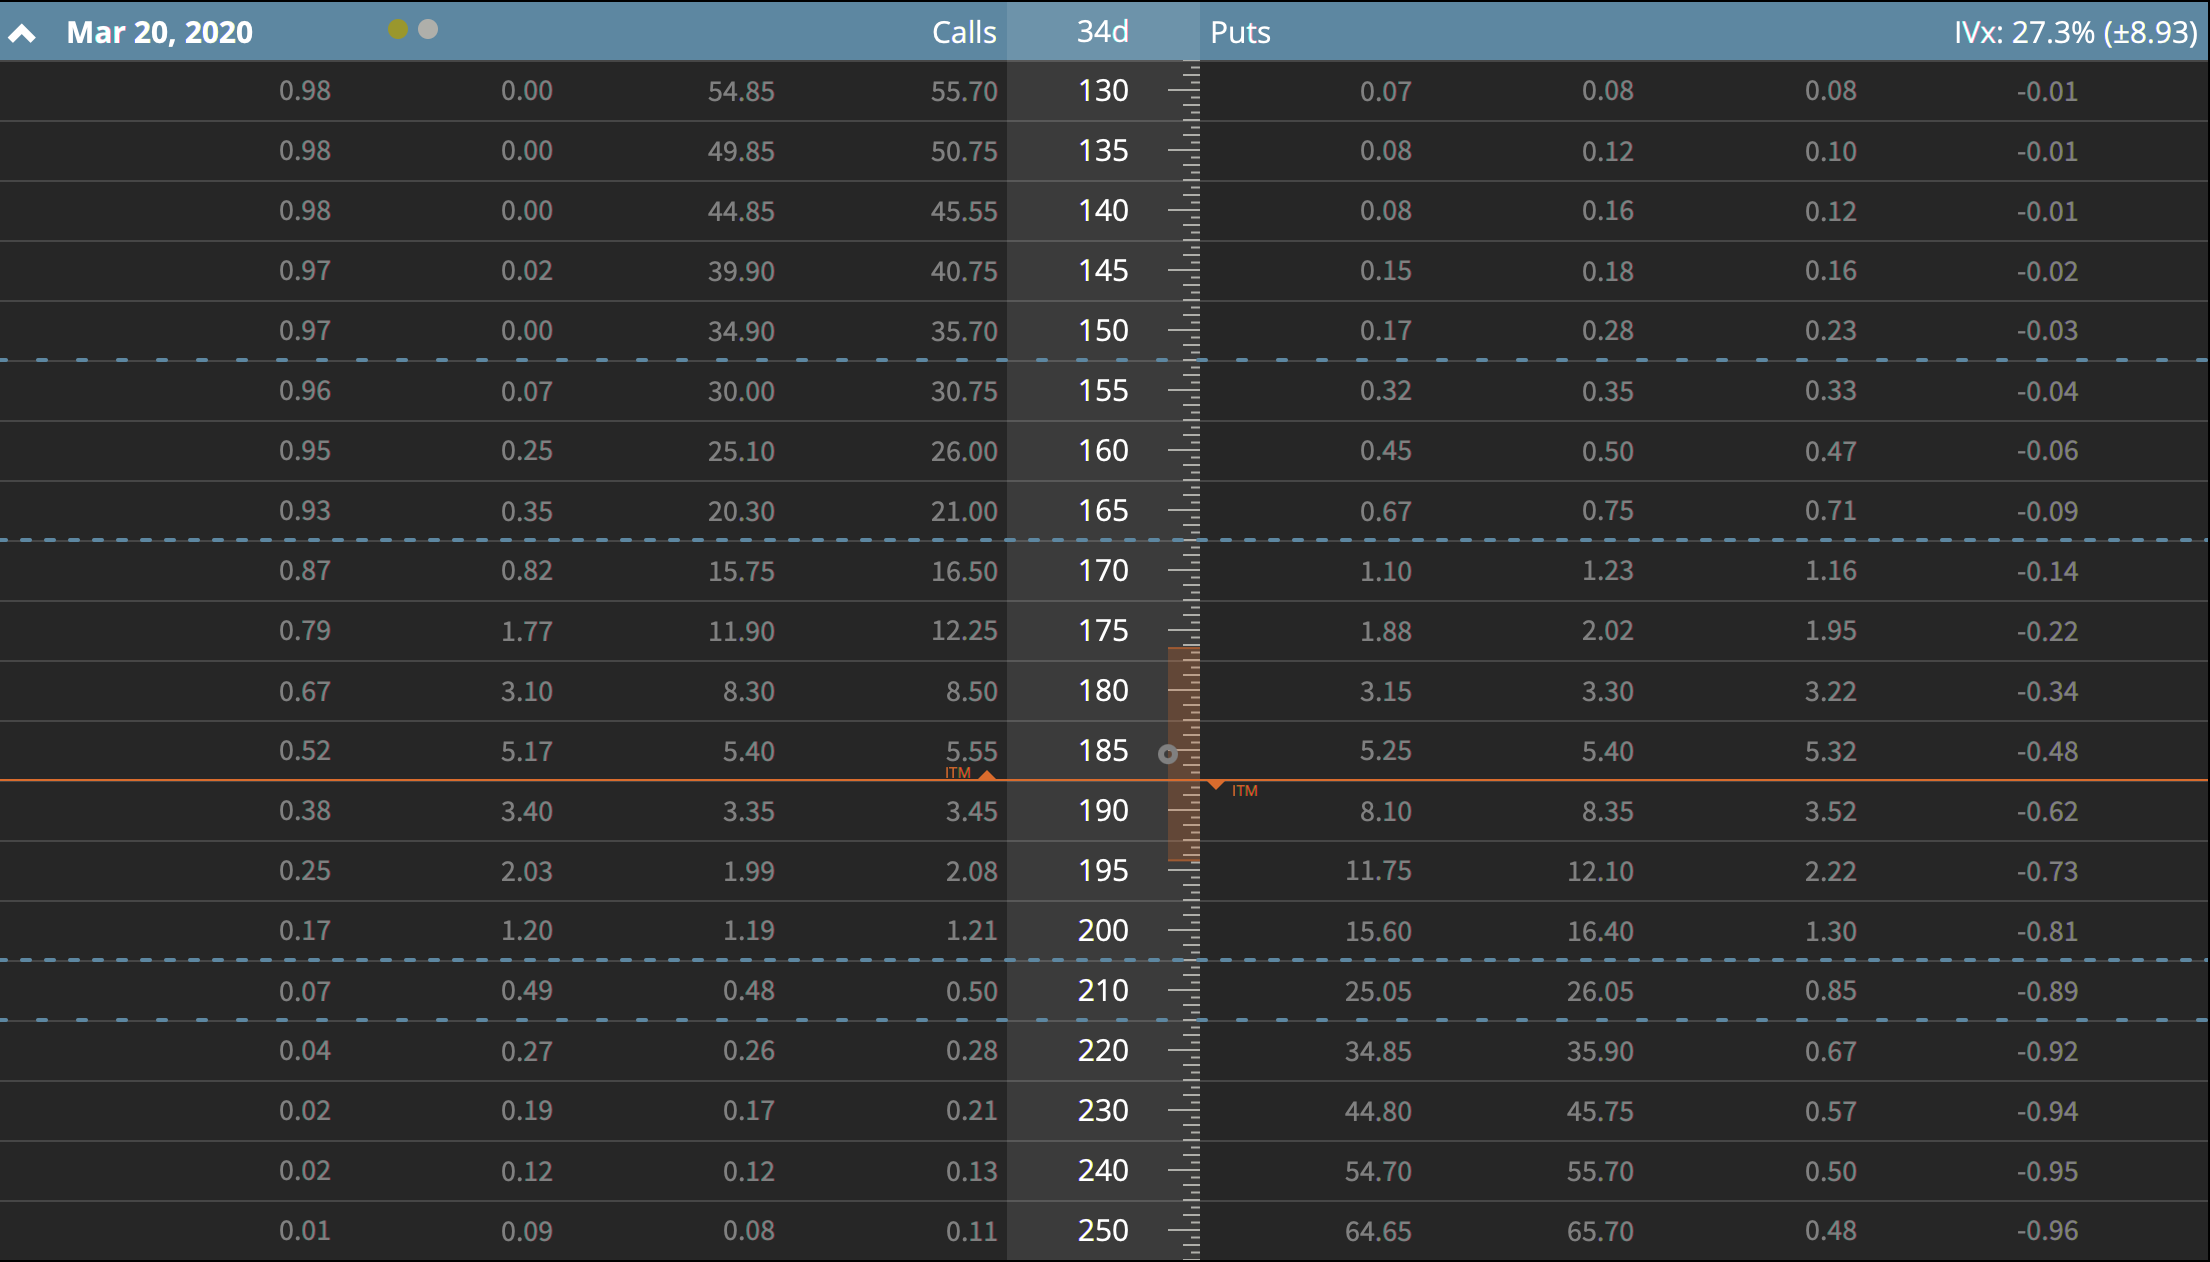
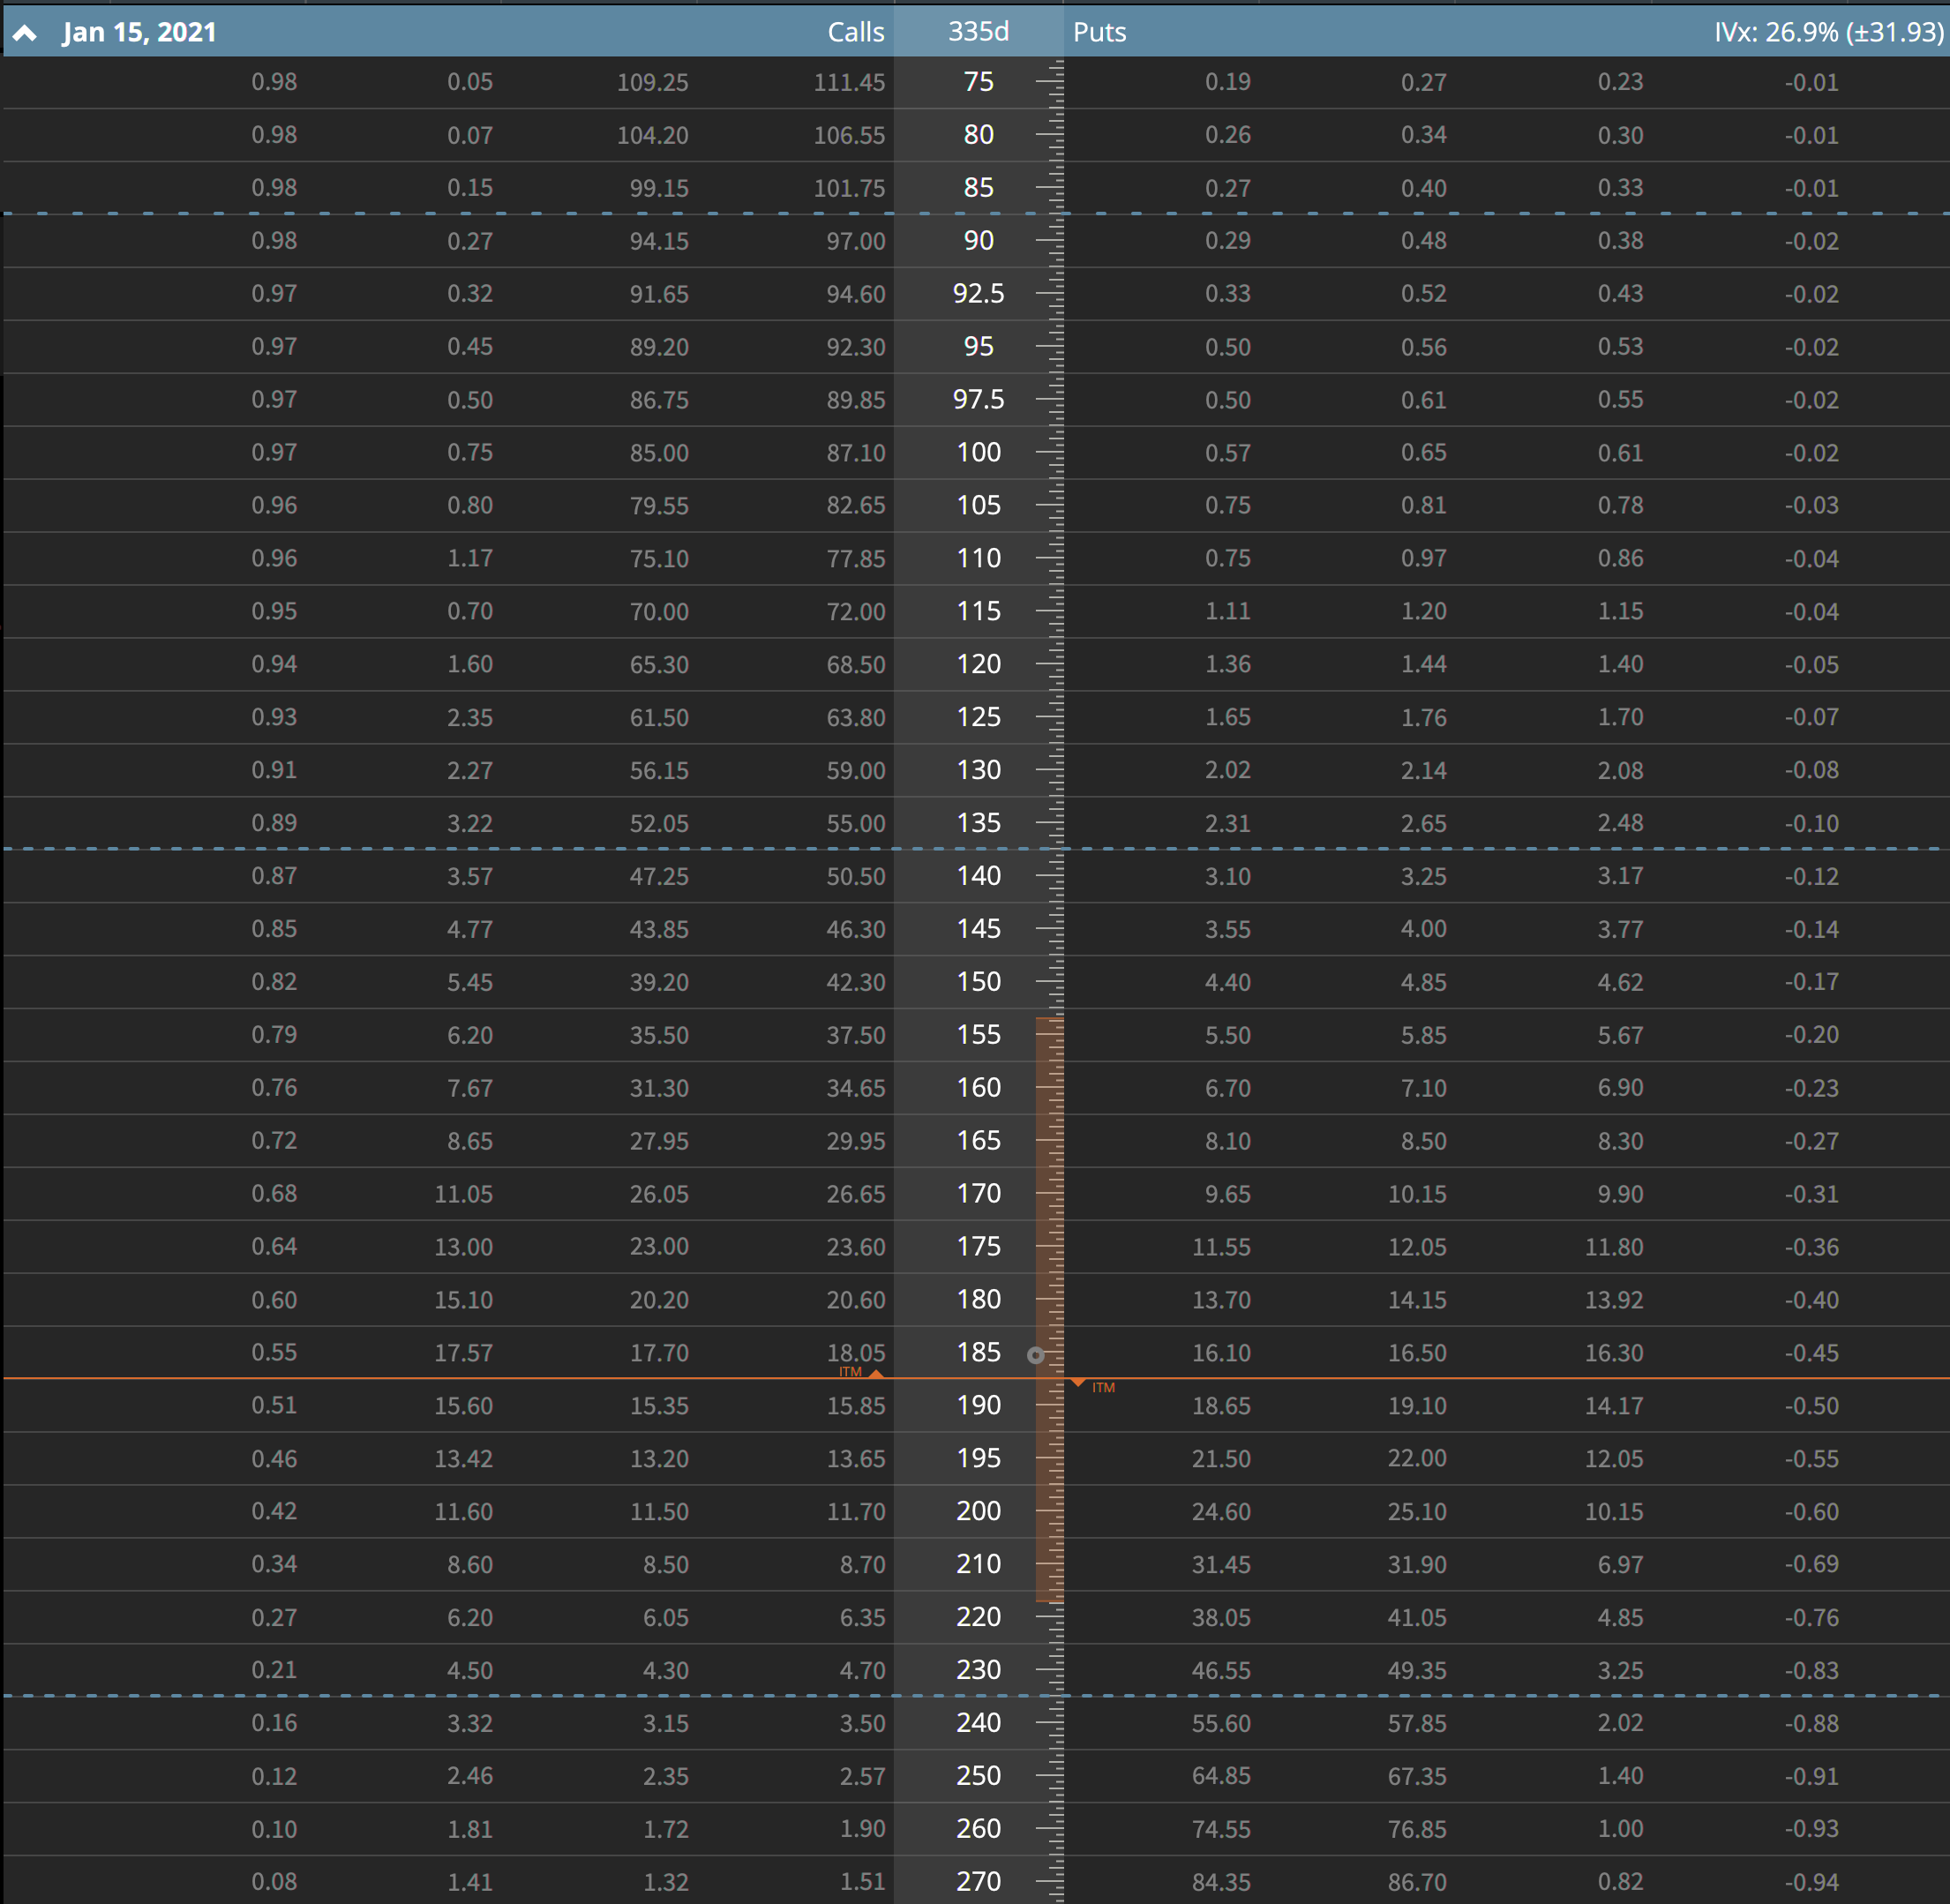
Wait a minute! This has an implied volatility of about 27% vs. CSCO at 26% – that’s basically the exact same thing for the next year! Yup.
So looking at MSFT, you see that the implied volatility is about 27%, meaning the expected move is around $9 through the March cycle, and round $32 for the next year. Microsoft is a much higher priced stock at ~$185 so the nominal price moves are greater.
Let’s take quick look at that 30 delta strangle as well. You could sell the $290 call (34 delta) and the $180 put (-34 delta) for about $6.65 in credit and you’d need to put up $3,240 per contract. The probabilities are 55% probability of profit, and 75% probability of being able to sell it for 1/2 the credit. So let’s see what that looks like. 1 contract, let’s say you only got $6.60 for the strangle and bought it back for $3.30. So $330 profit over $3,240 in buying power for a return on risk capital of about 10%. That’s a bit nicer than the CSCO 7%. Crazy huh!
IV Rank
So why on earth would two stocks with basically the same implied volatility have two totally different IV Ranks? I have to go away from Tastyworks for a moment to show you why – and I’ll use my IV Rank tool on TOS.
In a nutshell, IV Rank is the position of the current implied volatility relative to the historical implied volatility for the underlying security. Typically this is over the last year of observed implied volatilities.
Note: My calculations on TOS are not going to be the same as the ones on Tastyworks. The Tastyworks team has done a great job of building a real-time calc that is way more accurate than what I can do in TOS.
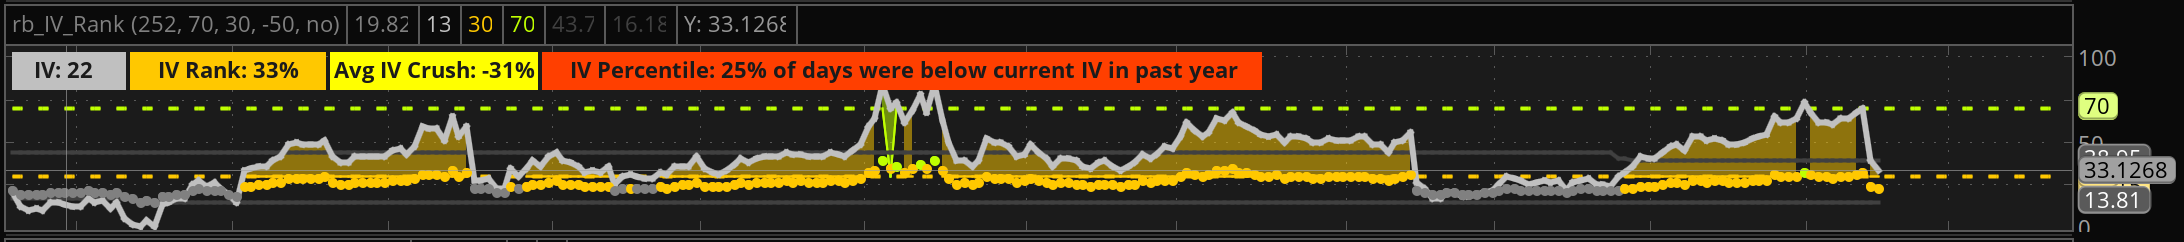
First, let’s take a look at CSCO. This chart is kinda difficult to read, but it shows the general change in implied volatility for CSCO over the last year or so. As you can see, it jumps around a bunch! It’s been as high as about 44% and as low as around 14%.
To make it simple, if you said that the range of CSCO’s implied volatility over the last year was between 14 and 39, or roughly 25 percentage points wide. The current IV is roughly 33% in the range from 14 to 39.
Simple eh? Okay, maybe that didn’t make any sense. Let’s try it slightly differently.
For CSCO, the highest implied volatility observed over the last 12 months was 38.95. The lowest implied volatility was 13.8. That gives us a range of 15.15 percentage points difference between the top and the bottom of the observed implied volatilities.
If we look at the current implied volatility of 22.15 and subtract the lowest observed of 13.8 we get a current implied volatility that is 8.35 percentage points above the lowest observation.
If the range of the highest to lowest observations was 25.15 percentage points wide, the current reading of 22.15 is 33.2% into the range.
Okay – one more time, maybe as a set of variables:
- Lowest = 13.8
- Highest = 38.95
- Current = 22.15
- Range = Highest – Lowest = 28.95 – 13.8 = 25.15
- Position = Current – Lowest = 22.15 – 13.8 = 8.35
- IV Rank = Position / Range = 8.35/25.15 = 33.2%
Makes sense? Good!
Let’s take a look at MSFT.

Oh, that’s interesting. That chart looks a little different. It looks like the implied volatility has climbed a bunch recently relative to the normal ranges for MSFT.
- Lowest = 16.91
- Highest = 32.56
- Current = 27.96
- Range = 15.65
- Position = 11.05
- IV Rank = 70.6%
Why does this matter?
Think about it for a moment. If you are selling premium, and option prices are based upon the intrinsic value, time and volatility (roughly) – then you want to sell when the price of volatility is higher relative to the normal price of volatility for an underlying security.
If you look back and the CSCO chart, you can see why this matters. CSCO just had an earnings event, in fact it was on the 12th of Feb 2020 after the bell. So let’s pretend that I wanted to sell a 30 delta strangle before earnings on CSCO.
We can use the really cool “OnDemand” feature in Thinkorswim to go and look at the historical pricing for this example. Pretty neat really. This is option pricing for CSCO on 2/12/20 @ 10:45 am EST.
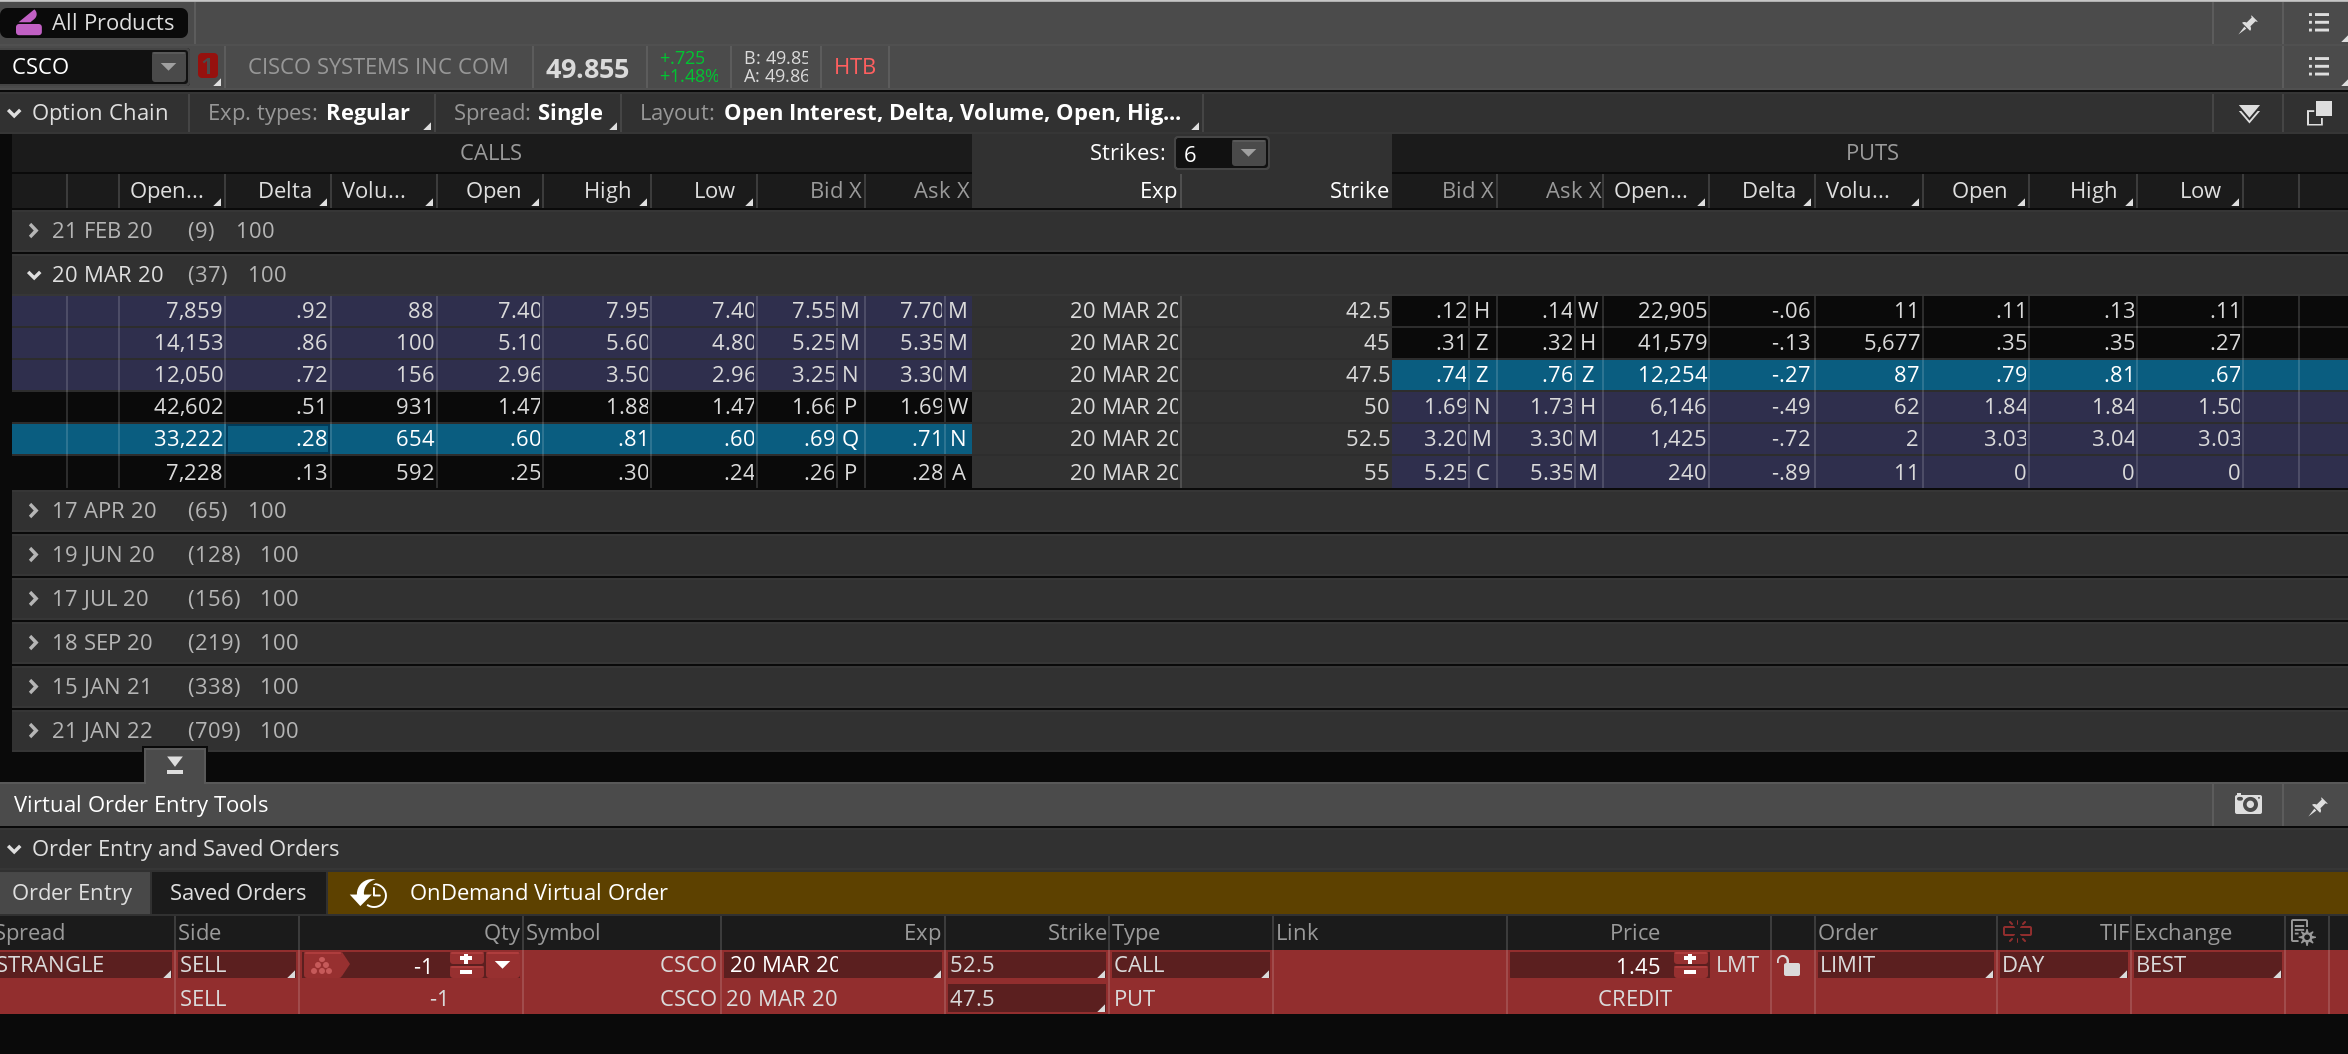
The 30 delta strangle on the 12th would be the 52.5 call and the 47.5 put for a credit of $1.45. Notice that is now a wider strangle (5 points, vs. 2.5 points) and I’m taking in more credit $1.45 vs.$ 1.28 today.
If you had sold the 52.5 call and 47.5 put strangle on the 12th for $1.45, you could have bought it back for $1.38 on the 14th even though your strikes had been breached. The contraction in implied volatility made a loser into a winner. CSCO is currently below your short put, the stock has moved against you by roughly 6% in a day and you still have a 5% winner on your hands.
Let’s go the other way and maybe you just had the brilliant idea that CSCO was going to come done to $47 by Friday. So you decided to simply sell a call spread, how about the 50/52.5 call spread for $0.97; today you could have bought it back for $0.16.
Maybe you prefer Iron Condors, so you sold the 50/52.5 by 47.5/45 for $1.41, you can again buy it back for $1.07 today.
All of this is because implied volatility today relative to implied volatility a few days ago is way lower.
Other than the call spread (which is basically cheating because I know what happened), every one of those non-directional strategies had a move strongly against the position. They are also all profitable.
Please don’t mis read that to think that all earnings trades are profitable. I had a max loser this last week as SHOP blew through expectations. I used a spread, it got smoked and no amount of volatility contraction can fix that.
Wrapping a bow on it
Hopefully this long meandering post about IV Rank is helpful. In a nutshell, IV Rank represents the current implied volatility of an underlying relative to its historical implied volatility. You generally want to sell premium when implied volatility is higher than when it is lower.
Selling premium in low IV Rank underlying’s is extremely difficult as your “edge” as an options trade has all but evaporated.